Summary
- Happy New Year! The MDA breakout testing completes our 8th year with simulated average cumulative returns of +295.8% following the signals.
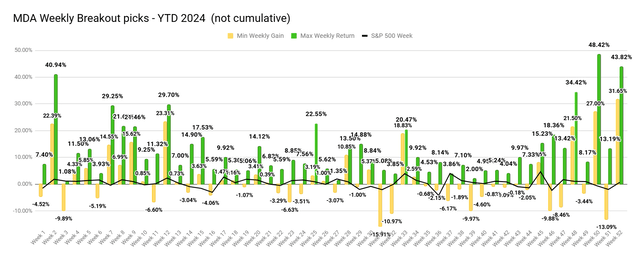
- The count of weekly portfolios with at least one stock gaining over 10% in less than a week increased to 308 out of 394 trading weeks (78.2%).
- All new Week 1 MDA picks have been released but continue with caution as we are in the longest negative signal since Sep 18th.
- Following Momentum Gauges® signals is crucial for maximizing returns, avoiding negative market conditions, and achieving consistent gains in volatile markets.
- Many new features will be added in 2025 with upgrades both to the SA platform for following my portfolios and to my company website with more charts and alerts.

Happy New Year!
The Weekly MDA Breakout results for 2024 were among the very best since I began testing the model live on Seeking Alpha in 2017. As I remind readers every week, these are high frequency breakout selections intended to deliver 10% gains in less than a week at rates much more frequent than the broader market. The arbitrary 1-week measurement period was set in 2017 to allow me to produce a good sample size for statistical analysis to see if it was worth my efforts to produce a fully automated MDA breakout website.

As we complete our 8th year testing financial models live on SA, this high frequency breakout model has produced +3,018.8% minimal cumulative returns following the Momentum Gauges® as part of this ongoing live forward-testing research. The frequency of 10%+ returns in less than a week is averaging well over 4x the broad market averages since testing began.