Introduction
This article begins an 11 part analysis on each of the Momentum Sector Gauges in a 3 year performance review starting with the Healthcare Sector Gauges. The Weekly Sector Gauge signals starting from October 2021 are applied to a variety of the most popular funds both positive (bull) / negative (bear) funds to examine the effectiveness of the signals and help to identify better performing sector funds for optimal returns.
It is important to understand that this is ongoing research and not a concluded model guaranteed for absolute success using every commercially available fund managed by thousands of different fund managers with different strategies and stock preferences in every market sector. All models are imperfect; some are useful.

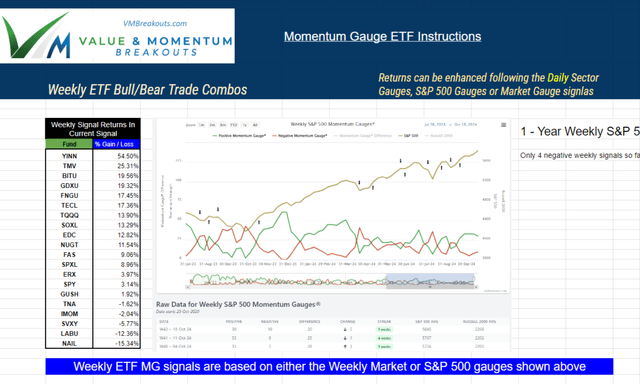
Three-year results spanning 156 weeks are shown above and I will dive into much more detail from the tracking spreadsheet screen captured from my Seeking Alpha marketplace service. Eventually, the automated momentum gauge website may include hundreds more ETF/ETN funds on the charts for selection, but until then this signal testing on my SA marketplace service provides important insights for your ETF trading using the live weekly signals here on www.vmbreakouts.com.
Understanding the Momentum Gauges®
My MDA statistical research has been applied to more than 7,500+ stocks in the US markets represented by the Market Momentum Gauges. For a thorough discussion of how the gauges work be sure to watch my webinar available here.
Adjustments in the sensitivity of the signals were used to produce the S&P 500 gauges for the 500 large cap stocks in the S&P 500 index. Most recently the model was expanded to all 11 sectors to create Sector Gauges that detect the direction of the major components in the market. Each of these signals is displayed and updated live at the top of the Momentum Gauge dashboard as illustrated below.

Each of these Market, S&P 500 and 11 Sector Gauge signals are all highly positive at the writing of this article. As the signals change, you may want to adjust your holdings accordingly. The dashboard above will only display daily momentum gauge signals. Further down on the website you will find each of the 11 sectors with choices to look at the Intraday, Daily, Weekly, and Monthly signals. For the purpose of this study looking back at the performance over 156 weeks, I will be focused on the Weekly Sector Gauge signals.
For the past 3 years all the member selected bull/bear 40+ combo funds have been tracked signal to signal and year to year. Currently we are in a strong weekly signal with large gains and only 4 negative weekly signals on the S&P 500 gauges this year avoiding -173 points of decline in a very positive year.
Originally all these member selected funds were tracked manually on Daily Market Gauge signal charts representing the 7,500+ stocks equal weighted across the US market. Manually, this is an intensely laborious data entry process for all the Daily signals for all the funds every year. But worse, many of the funds I tracked have nothing to do with the US stock market or less to do with all the stocks in the major US exchanges.
Funds like FNGU represent only 10 stocks and UVXY has no stocks in the fund. It makes little sense to signal those FNGU Mega Caps using all the signals of 7,500+ stocks. The short comings of the current signals have been well documented in this launch article on the Momentum Gauges and the application for ETF/ETNs :
We all know that it makes much more sense to signal funds based on the specific stocks, indices, markets, or industries that apply directly to fund we want to trade. A brief reminder of a few concerns I expressed toward making this an extremely successful ETF trading system:
There are many important factors to consider when trading ETF/ETNs using the many different Momentum Gauges and different time periods:
- There are over 2,800 funds to choose from on ETF.com and the “best” fund for each sector is unknown.
- Every fund has different composition, rules, limitations, securities, derivatives, equities, and management companies.
- Even within the same sector you will get many different types of leveraged funds with some that use 3x, 2x, 1.5x and many with no leverage.
- Nearly every sector has more than 20 funds to choose from and trading volume is an important consideration to avoid slippage and price manipulation.
- ETFs and ETNs have different tax rules, different restrictions, and different construction that creates different risk if a fund fails.
- Two opposite funds (a negative bear and positive bull fund) have been selected for each sector gauge with the intent to pair the same company funds whenever possible.
- Every fund company and every fund have different management styles, stock investment weightings and the number of stock selections will deviate from momentum gauge values measuring an entire sector.
- Some sector funds like MicroSectors U.S. Big Oil Index 3X Leveraged ETNs NRGU and -3x Inverse Leveraged NRGD each have only the 10 largest oil stocks. While other funds may have over 100 oil & gas stocks ranging from micro cap to mega cap stocks.
- Like NRGU/NRGD funds get discontinued frequently by the fund companies with new funds launching every day with no history to analyze.
- Every sector has a very different size both in number of stocks and in market capitalization. Technology for example is extremely large in market cap and number of stocks while Utilities is very small in both.
- Eventually I hope to identify the best performing funds for each of the sector and market gauges that represent each index and sector the best.
Any defects you identify in the signals applied to the selected funds could relate to a wide variety of these inconsistencies. It is impossible to remove all imperfections when applying signals from 11 sectors to over 2,000 funds with different methods, management, leverage, and compositions.
Healthcare Sector Gauges

Next, lets examine the Healthcare sector gauge signals over the past 3 years. Each sector on the AMG website can be analyzed using signals for intraday, daily, weekly, and monthly. For this report I will focus only on the Weekly signals and also include the early Weekly signal shown on the AMG website each week. Normally, I just apply the broad Market Momentum Gauge signal to all the different funds I am tracking. Now I can greatly enhance that approach and take the specific Sector Gauge signals and apply them more directly to any funds we think may more closely relate to the healthcare sector in US markets.
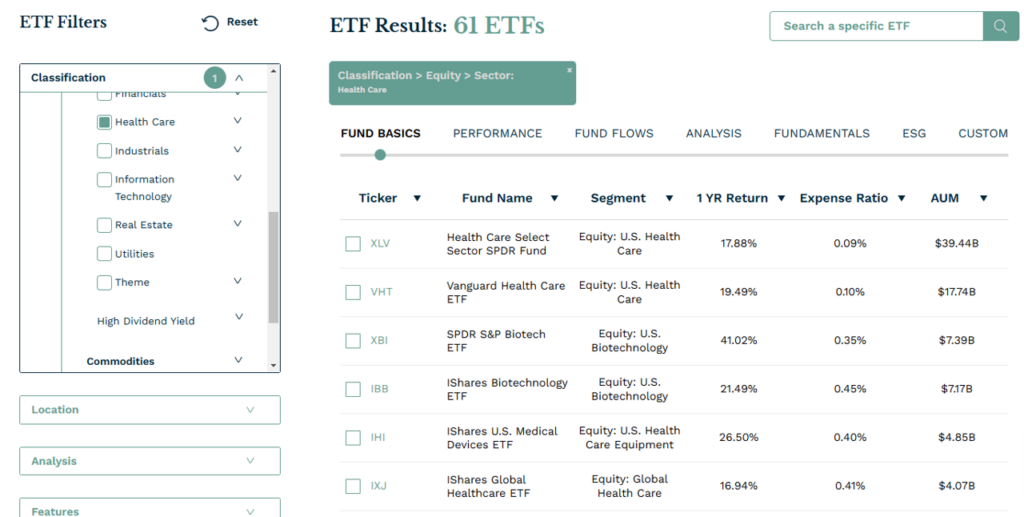
This study greatly expands on prior research with 3 years of specific sector gauge signals applied to 12 of the largest and most common healthcare funds managed by different investment companies with different strategies and compositions. However the ETF.com website lists 61 different funds related to the Healthcare sector. Ultimately, many more of these funds may be automatically included and tracked on the AMG website.
Using all the Weekly signals from October 8, 2021 through October 25, 2024 the results came out as follows. You can certainly explore this in more detail with me on the new tabs on the ETF Dashboard spreadsheet. Here are some of my observations:
- The Mid-week early signal is highly profitable, suggesting that even better results exist using the daily financial sector gauge signals.
- Both the Mid-week and End-week financial sector gauge signals beat the Buy & Hold approach over 156 weeks (last 3 years).
- All the returns shown from the signals were accomplished during 75 weeks of positive signals or 48% of the trading time than the Buy & Hold.
- I didn’t bother calculating the draw downs over the past 3-years, but clearly the Buy & Hold period will include much larger draw downs than when following signals. Meaning, that you have to have a tough stomach to hold these funds for 3 years straight without using any exit/entry signals.
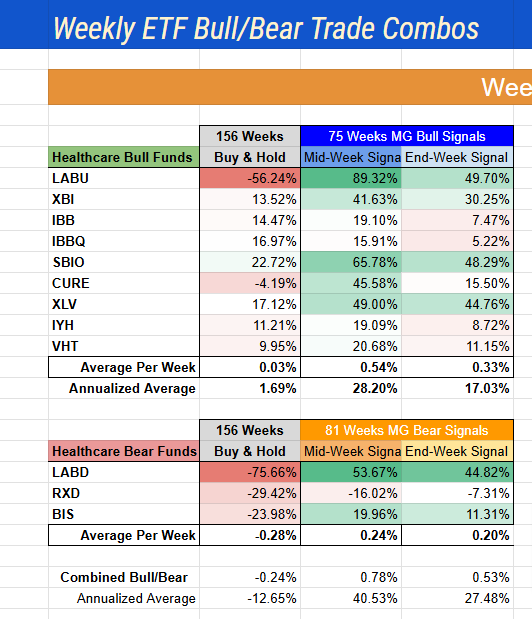
Each of the nine different bull (long) healthcare funds and three different bear (short) funds run by different companies, managers, goals, and composed of different stocks was analyzed in three different categories: Buy/Hold, Mid-week, and End-week signal. Buy/Hold is self explanatory, holding with no selling over the entire 3 year period. End-week signal refers to trading on the official end of the week final signal for the week ahead. Mid-week signal refers to the yellow highlighted early signal that the AMG website provides on the charts mid-week or earlier depending on the length of the trading week.
In nearly every tested fund the Mid-week signal outperformed the Buy/hold approach for each of the different funds. Most importantly, the returns using the Sector Gauge signals were accomplished in less than HALF the trading time following the positive signals. The End-week signal returns were also substantially better than a pure Buy/Hold approach in nearly every case, but you can see how much the Healthcare returns differed according to the fund manager selected stocks. Next we can look at these returns visually and try to understand why funds like LABU / LABD had such negative Buy/Hold returns but outperformed using the Sector Gauge signals.
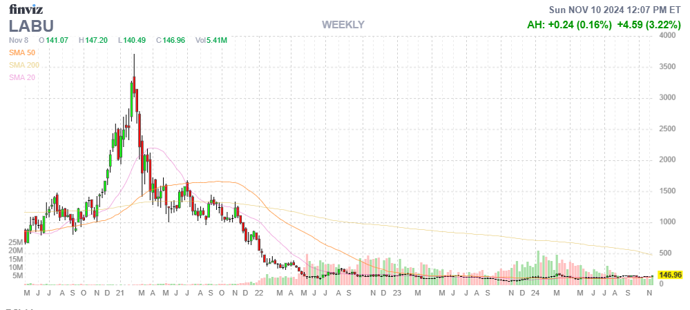
LABU 3x Biotech bull fund shows the strong gains from Covid three years ago that soon faded into large declines with occasional rallies in recent years. The inverse bear fund LABD -3x Biotech shows these leveraged returns in an inverse way that also suffers from large decay related to the derivatives that inverse funds use to create gains on declining stocks.
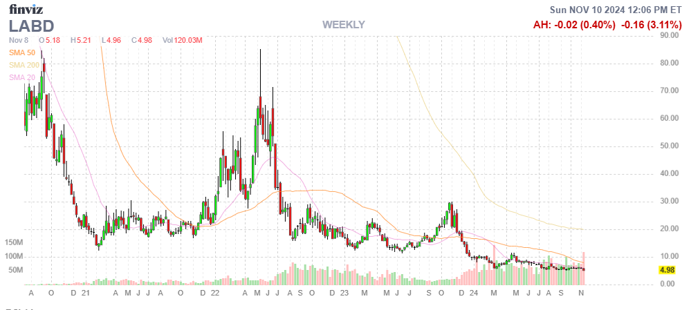
The comparison of the funds run by Direxion Daily S&P Biotech bull funds shows that neither fund has positive returns over the past 3 years. By contrast SBIO ALPS Medical Breakthroughs ETF performed the best in a Buy/Hold return measurement +22.72% since October 2021.
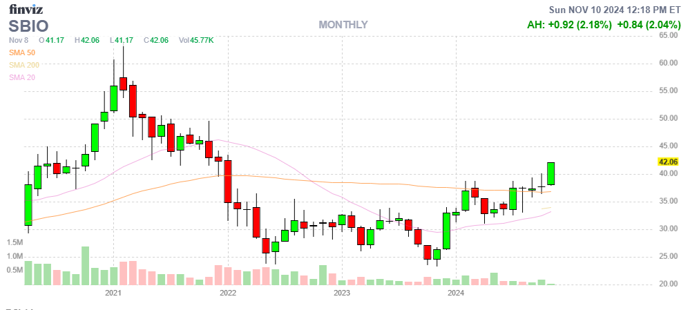
On the 3-year monthly chart for SBIO above you can see the fund turning sharply positive back above levels in October of 2021. A buy/hold approach of the best performing Healthcare fund SBIO over the past three years would not be positive until these last few weeks of the measurement period. An investor in this fund or any of the tested Healthcare funds using a buy/hold approach would have lost precious weeks and months if not large percentages of their investment capital.
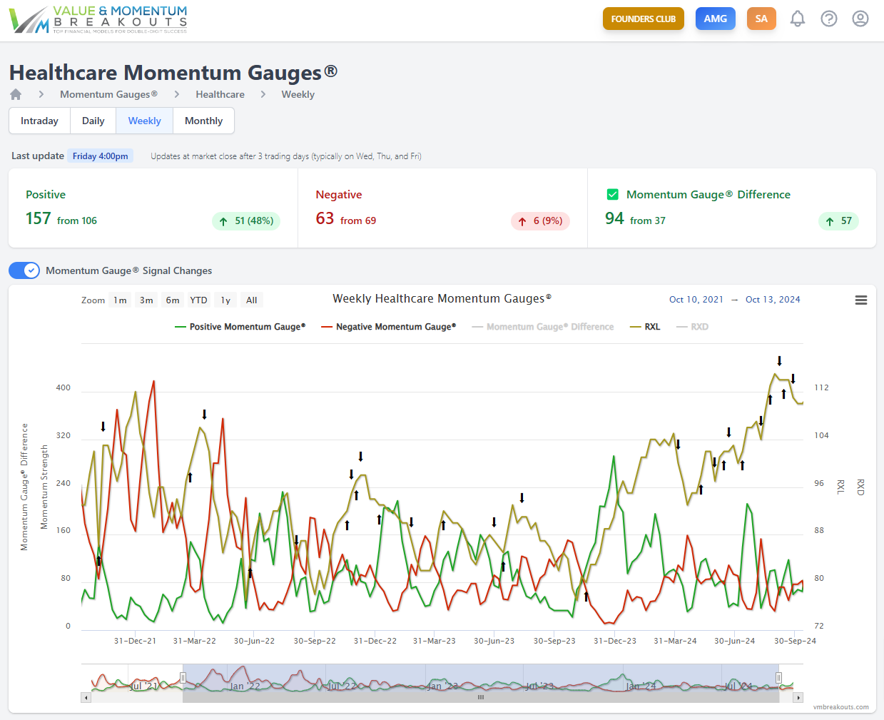
Lastly, the Weekly Healthcare Sector Gauge signals are shown from October 2021 and are applied RXL ProShares Ultra Healthcare 2x bull fund shown in yellow with black signal arrows applied. The yellow line would differ greatly depending on which Healthcare fund was used to proxy the signals. While the features to toggle many more of the 61 available Healthcare funds from ETF.com have not been developed yet, you can toggle between bull/bear funds like RXL and RXD at the top of the chart.
More importantly with this new 3-year study you can see how it important it is to choose the best sector fund run by different companies and fund managers as they try to represent the Healthcare sector. Additionally, you can see how much more of your time is saved by following signals to obtain the same or better returns in the market. Furthermore, even in the top performing funds like SBIO that are now turning positive again after nearly 3-years negative, you would have to stomach huge declines over -50% in the best funds to reach any positive results in the Buy/Hold approach.
Conclusion
There is much more research and analysis to be conducted on these signals. However, all the indications show statistically significant results from the Momentum Sector Gauges are highly profitable over different intervals and using different funds. Those who have been with me over the years know that this study is not a final product. I am diligently working on many more enhancement projects both on Seeking Alpha and on my www.vmbreakouts.com website to reach the goals detailed in my doctoral research. I plan to release project articles and forecasts of many goals I am pursing across the different platforms in my life-long research studies.
All of these tests and studies take time, energy, and a variety of resources to keep me going on my ultimate trading goals. Your interest and feedback makes this journey much more enjoyable and I trust with patience you will benefit greatly. My services are always focused on producing the best possible results I can for each of you, but all my work continues as a multi-decade research project with many more years to go!
My goal for the start of 2025 is to complete this new Sector Gauge signal manual tracker for all 11 sectors on Seeking Alpha. At the same time I am looking to add hundreds more of these different company managed funds to the AMG website for all the live signals and SMS/Email trading alerts. The final step will be to link the funds to fully automated trading platforms based on these signals that you can use in your own live trading. All models are imperfect; some models are useful.
All the best!
JD Henning, MBA, PhD

