Summary
- The MDA Breakout model achieved +3,018.8% cumulative returns since 2017, with frequent 10% gains in less than a week, outperforming the broad market averages.
- Market Momentum Gauges indicate negative market conditions again from December 13th and caution is advised until we get more positive signals.
- Week 3 MDA picks focus on Energy stocks benefiting from strong sector momentum and large net buying.
- Week 2 selections saw 3 of 4 picks break 10% peak gains through Monday, but they all gave back considerable gains in the negative week.
- 8 years of testing in an arbitrary 1-week period shows that following the Momentum Gauges significantly improves returns and reduces risk.
- Be sure to read the Getting Started Instructions and follow the first two steps to help you build your Optimal Portfolio mix for your best risk/returns in 2025!

Happy New Year!
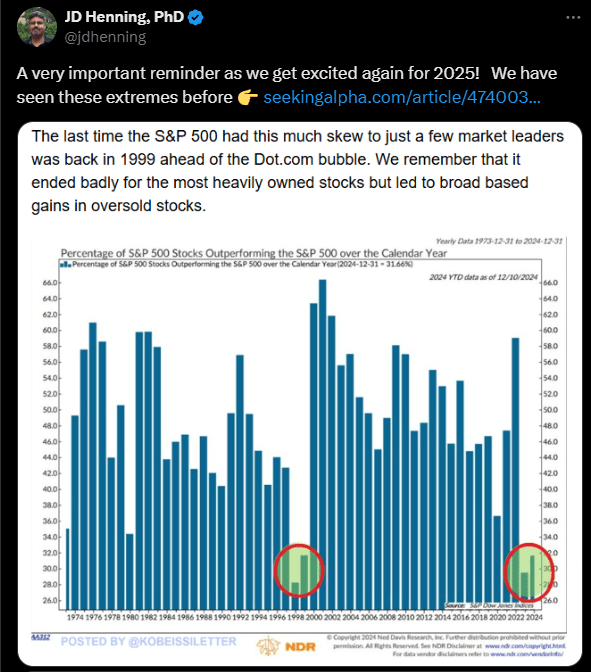
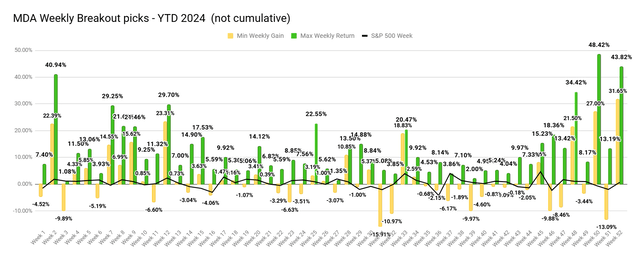
The Weekly MDA Breakout test results for 2024 were among the very best since I began testing the model live on Seeking Alpha in 2017. We are also in the most positive two-years for the S&P 500 since 1998 right before the dot com bubble. It will be important to watch the Momentum Gauge signals and market behavior as we trade in another exciting new year.

As I remind readers every week, these are high frequency breakout selections intended to deliver 10% gains in less than a week at rates much more frequent than the broader market. The arbitrary 1-week measurement period was set in 2017 to allow me to produce a good sample size for statistical analysis to see if it was worth my efforts to produce a fully automated MDA breakout website where signals can be followed for much longer than this 1-week fixed measurement test period.

As we complete our 8th year testing financial models live on SA, this high frequency breakout model produced +3,018.8% minimal cumulative returns following the Momentum Gauges® as part of this ongoing live forward-testing research. The frequency of 10%+ returns in less than a week is averaging well over 4x the broad market averages since testing began.
New charts for January 2025 will start as more weekly data comes in. The best weeks on the chart corresponded with strong positive MG signals and the worst weeks had high negative MG signals. That has been true now through 8 years of testing and is why I release the MDA selections in good signals and bad signals to show the importance of following the gauges for the best results. If market outflows are large it will be hard for even the best stocks to find buyers.


