Summary
- Market rotations are key to investment success; avoid purely buy-and-hold strategies to mitigate downturns and capitalize on sector shifts.
- Timing is critical; historical data shows that 20-year returns often fall short of the average 8% due to market entry points and unrealistic averages.
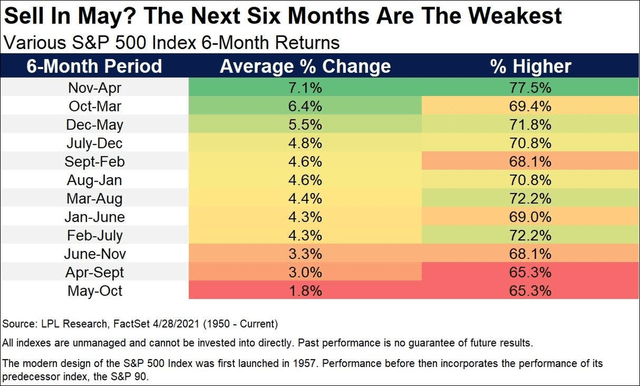
- Q4 historically offers strong gains, and the November-April period averages the most positive 6 months since 1950, but monitor mega-cap behaviors and broader market movements.
- Sector Gauges and the increasing frequency of breakout stocks can lead us to where the best opportunities may be found.
- Segments within the Financial sector offer great opportunities with regional banks and capital market segments related to crypto-currency with sample selections.

Introduction
This article serves as both my outlook for 2025 with the latest Momentum Gauge® signals and a revisit of the January Investing Experts Podcast interview with Rena Sherbill at Seeking Alpha. The MDA statistical approach referenced throughout stands for multiple discriminant analysis and relates to the application of dozens of variables simultaneously to produce inductive analytical results.
What I offer is intended to provide a model for future success, as well as build on prior signal events with more insights on how to benefit from changes in the market momentum conditions. Insights may be familiar to long-term readers, but the ongoing sector rotations continue to give us many new opportunities for profit in the years ahead.
The Brutal Rotations
Somewhere over the past 35 years of trading and researching the markets, I discarded the notion of being a pure buy and hold investor. People may do well in buy-and-hold approaches, but they invariably have to ride through some major downturns to arrive with good results in the end. Back in the days when I relied on well-known investment firms for advice, I often received more coaching about my patience than any valuable insight about market behavior. Like many of you, my cynicism and curiosity about the financial markets led me to test, experiment, and run studies across thousands of different trading approaches, algorithms, and models. Here’s a 10-minute view of what I have learned over the years.
“The thing to consider is that we rarely ever see market leaders from the prior year be market leaders for the coming year.” ~ JD Henning, January Podcast
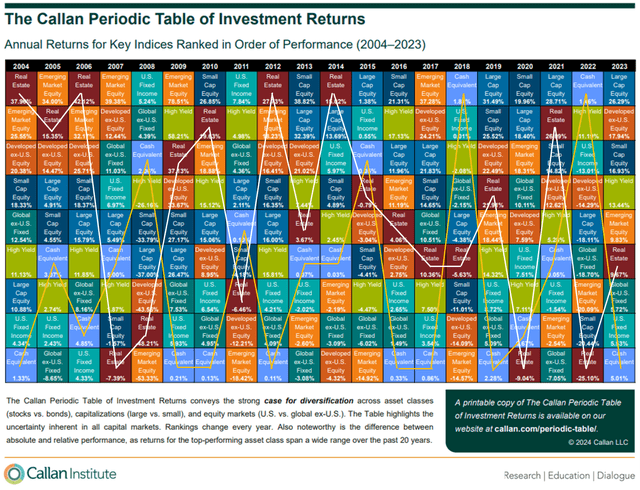
Let’s start with a brief review of the Callan Period Table, showing the performance of key indices over the past 20 years. Without a doubt, there is very little consistency year to year with investment types and sector leadership. Some more cynical investors have observed that the financial industry relies on churn, on the constant trading of securities for profits, much like realtors need frequent inventory turns. Some in the industry work on percentages of gains and have a more vested interest in your profitability. Whatever your view, I prefer to think that rotation is a product of all our choices, global policy changes, conflict, Covid, interest rates and the constant pursuit of millions of traders to stay one step ahead of the next major rally.
Before we get into the next potential rotation and examples of what is occurring in the markets ahead of 2025, let’s consider market resilience and the critical factor of TIME. Many investors are told that the S&P 500 averages 8% annual returns if you’re patient. The reality is that the 20-year average returns of the market depend heavily on where you enter the measurement period since 1900 that produced the average 8% returns.
Investment studies should align time frames with human mortality rather than focusing on “long-term” average returns. There are periods in history where real, inflation-adjusted total returns over 20 years have been close to zero or negative. Interestingly, these periods of near-zero to negative returns were typically preceded by high market valuations-as we see today. ~ Lance Roberts
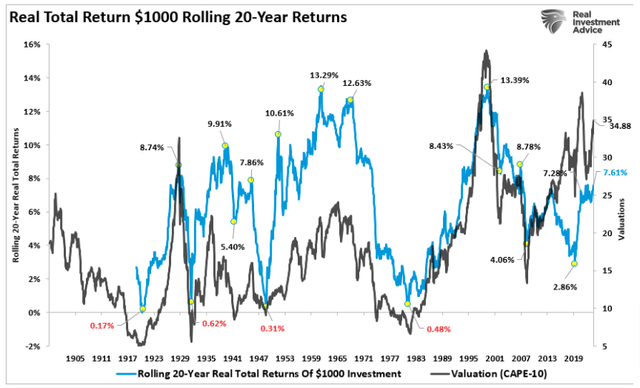
Timing is such a critical factor in avoiding major downturns and loss of capital, and few investors ever achieve the promised returns over 20 years. Return percentages highlighted on the blue 20-year rolling returns plot illustrate how often a 20-year investment returned much less than 8% average annual returns since 1900.
Market Index Resilience
As I write this, Goldman Sachs is calling for a 6,500 target on the S&P 500 and Mr. Hartnett at Bank of America Merrill Lynch sees even higher targets.

Market resilience is actually more of a reflection of the corporate Market Indices and how they operate.
Market Indices are quite different than the US stock market. Long time followers know that I often put “market” indices in quotes when discussing the three most popular corporate indices: S&P 500 (SPY) (SPX), Nasdaq 100 (QQQ), and the Dow Jones Industrial Avg (DJIA). These indices omit over 6,000 US and 10,000 OTC market stocks while overlapping on fewer than 600 of the largest stocks traded on the US exchanges. ~ JD Henning, PhD
Sometimes we hear traders say in frustration, “How can the Dow be up +400 points today, and my portfolio be flat or negative?” First of all the Dow reflects only 30 stocks out of more than 17,000 stocks available for trading in the major U.S. exchanges and OTC markets. The Nasdaq 100 offers 70 more large cap stocks, and the S&P 500 yet another 430 stocks, with many stocks overlapping across these “market” indices. It is very important to know what you are measuring when you look for opportunity in the stock “market.” Some prior articles that may provide more insight on this include:
- Record Market Skew Leads To Broadest Stock Breakout Since November
- Technology Hitting The Peak Of The 2024 Market Cycle With Rotation To Value
Long-term readers remember this chart of the ongoing S&P 500 skew relative to the equal weighted S&P 500 index. As I cautioned in the prior July article, it reflects the extreme skew into the Magnificent 7 that may now be unwinding to the great benefit of the broader market.
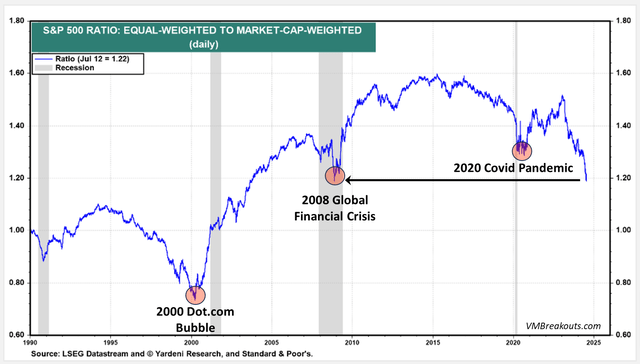
Rarely do we ever see a market index collapse on the scale of the Global Financial Collapse in 2008 or Covid in 2020. What is more common is a sector or industry correction that leads to accelerated rotation below the index surface. These more common sector rotations can feel like a market crash to investors loaded up on past winners. The way I answered the question back in July was:
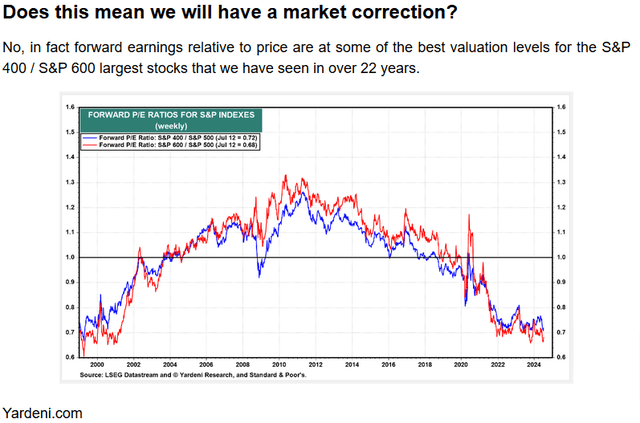
Next we will look at a couple major sector corrections while the market resilience has powered higher to peak S&P 500 gains over 6,050 in November. Keep in mind, we can still see more sector and industry declines while the broader market lifts the “market” indices to the forecasted new all-time highs.
Semiconductor Market Correction
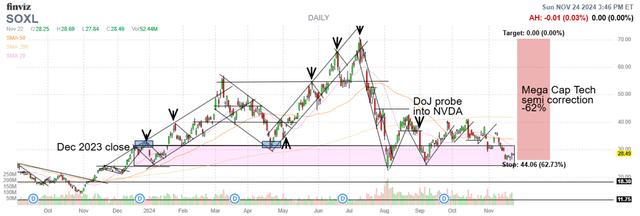
When I last wrote about the extreme market skew in July and the peaking of the Technology sector back in April, nothing was more exciting than the semiconductor industry with massive NVIDIA (NVDA) gains. Since then, the Direxion Daily Semiconductor 3x bull fund (SOXL) illustrates this correction well, down over -60% from the July highs despite ongoing strength in NVIDIA.
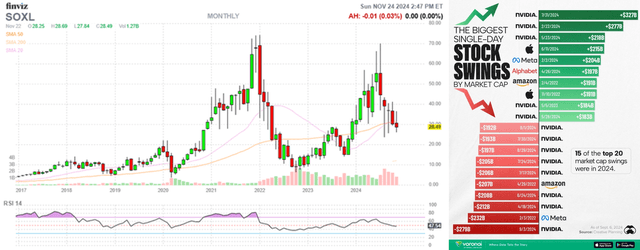
The semiconductors are the largest component of the Technology sector that is also the largest sector by market cap with the highest weightings on the major “market” indices. The volatility is most evident on the SOXL eight-year chart shown below, with NVDIA responsible for most of the largest market cap swings in history. 15 of the top 20 largest market cap daily swings were in 2024.
The mega cap giants have an enormous weighting on the market indices. They are also concentrated in the Technology sector where Apple (AAPL), Microsoft (MSFT), Nvidia (NVDA) and the rest of the semiconductors like Broadcom (AVGO), Advanced Micro Devices (AMD), Intel (INTC), Qualcomm (QCOM), Micron (MU) and many others have much larger market caps than other sectors combined. As a result, I find it very important to follow and chart the technical indicators of BMO REX MicroSectors FANG+ Index 3X Leveraged ETN (FNGU) representing the 10 largest stocks in the US stock market.
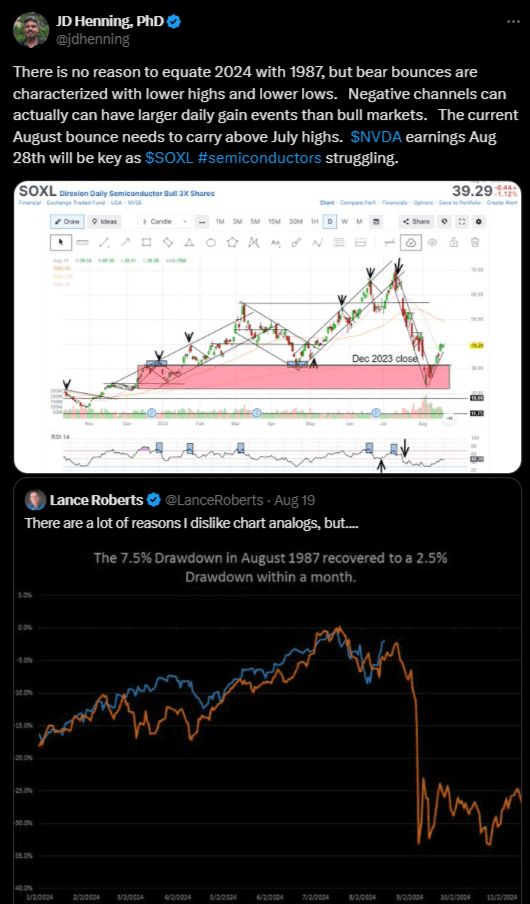
Back in August, the semiconductor selloff was so brutal that prominent stock advisors were making comparisons between 2024 and the 1987 market crash. Since then, no market crash has occurred, but instead we are seeing a rotation to the broader market where many lagging sectors are picking up the slack.
Bank Collapse in the Financial Sector
2024 started the year with the largest bank collapse since Silicon Valley Bank was acquired by New York Community Bank, now called Flagstar Financial (FLG).
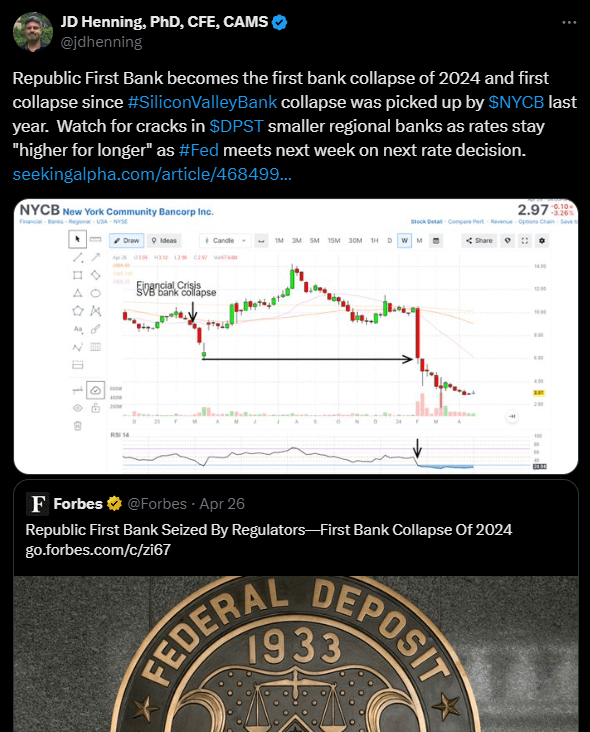
The financial correction was yet another element of the sector rotations discussed back in Q1 and more recently here, as the out-of-favor banks begin to rally:
All these examples of sector declines will continue to contribute to the ongoing rotations that lead the indices higher until we finally see another broad sector selloff, especially across the mega cap sectors Communications, Technology, and Consumer cyclicals.
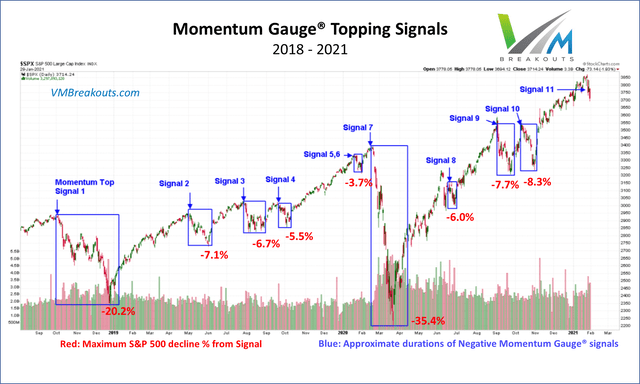
Only when a majority of the key sectors or industries most heavily weighed on the S&P 500 (SPX) (SPY) all breakdown together can it trigger a market collapse. Since my research began into markets using the MDA model that I call the Momentum Gauges, the two largest Market Index corrections have been in 2018 for -20.2% and in 2020 for -35.4%.
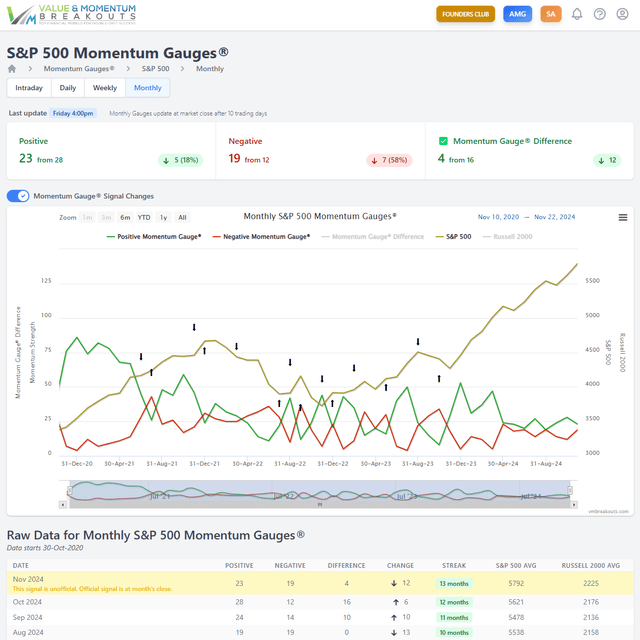
Currently, the Monthly S&P 500 Momentum Gauge chart is pushing to new all-time highs from the Covid lows of 2020 to today’s longest stretch of positive monthly signals since November 2023. It is easy to look back at the S&P 500 gains from 4270 last November to the current November highs of 6053 and forget all the volatility and harsh comparisons to the 1987 correction.
The Next Rally Opportunities
As I have shared frequently and many readers have seen in my morning and weekly update articles, Q4 averages the best quarterly gains of the year in what is called the January Effect or the “Santa Claus Rally.” Not every sector and industry will participate, but I think this year it could be particularly strong for the lagging sectors and small-cap stocks.
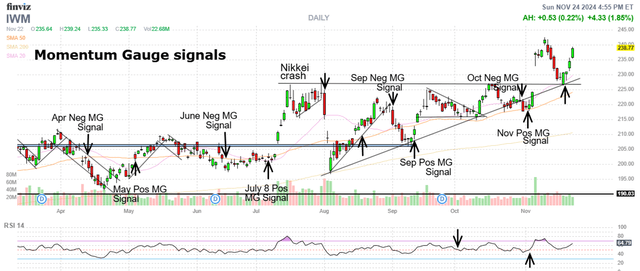
Russell 2000 (IWM) Index Fund in strong breakout conditions post-election, finally clearing 225/share resistance into November for potential rally into Q1 of 2025. Related funds could include (TNA) 3x Russell bull fund, (LABU) 3x Biotech bull fund, and (RETL) 3x Retail bull fund. Certainly, the Bitcoin trade represents risk appetite and benefits many small cap financial sector stocks, especially in the capital market segment.
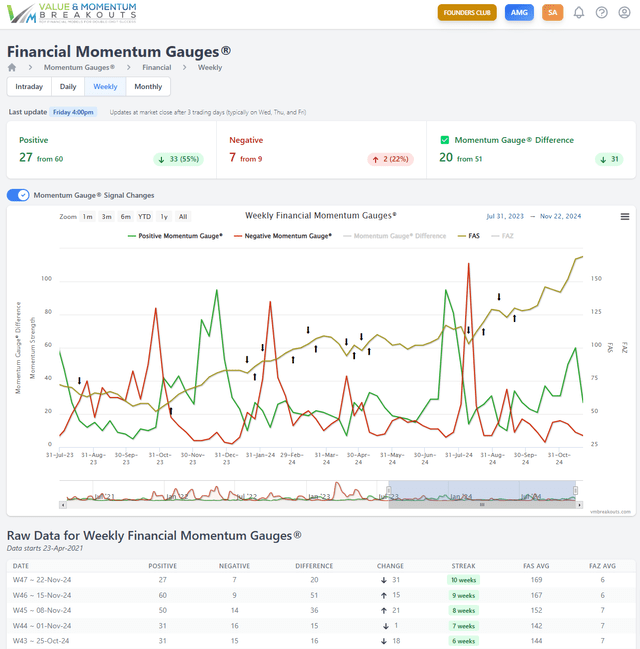
Additional sectors like the Financial sector gauges shown below are in strong positive breakout conditions on the weekly chart with prior peaks above 90 on the Momentum Gauges and room to run.
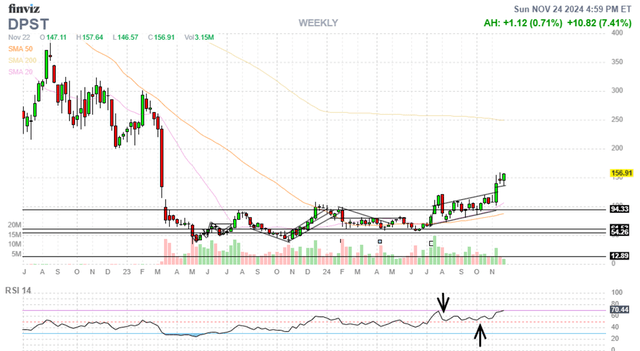
One of the ways to benefit from this trade is in the (DPST) Direxion Daily Regional Banks 3x Bull fund for a rebound into 2025. This trade favors the smaller cap banks and out of favor regional banks that are starting to show strong signs of recovery, up +42.7% from our daily breakout signal on October 24th.
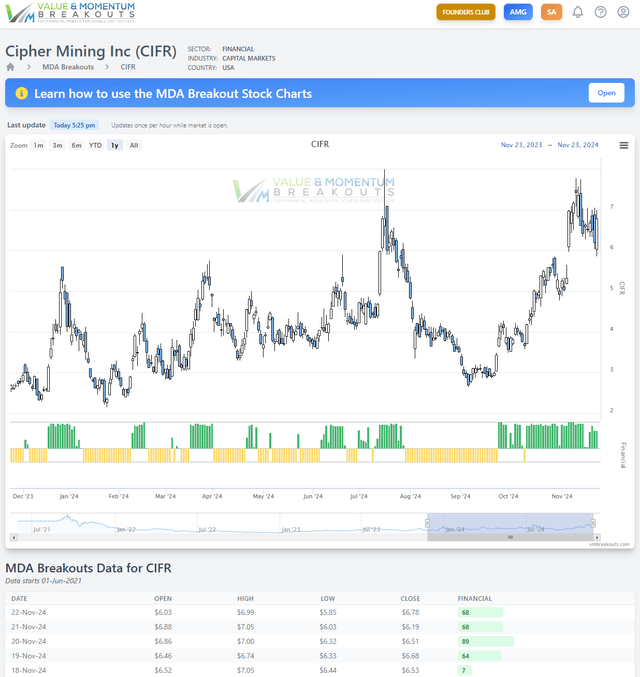
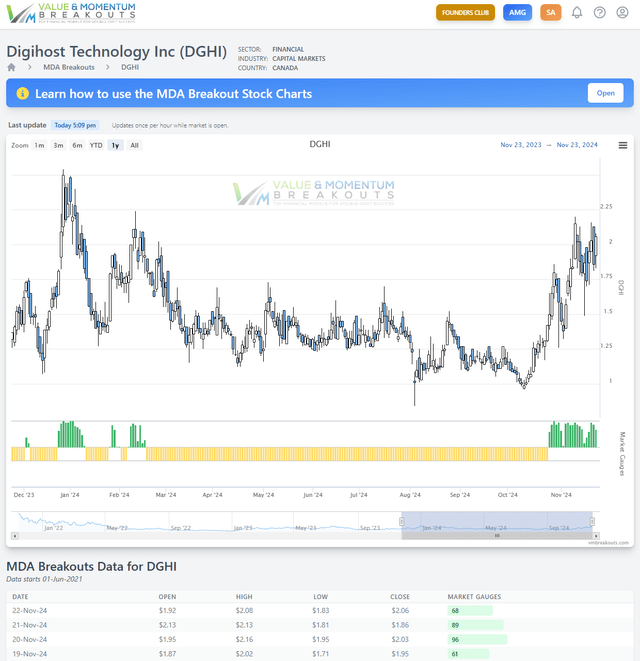
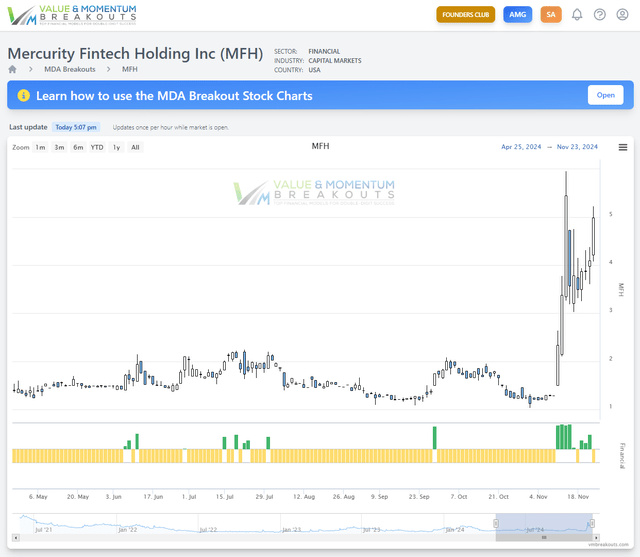
In the capital market segment within the Financial sector, some of the individual top picks are related to crypto-currencies like:
Cipher Mining Inc. (CIFR)
Digihost Technology Inc. (DGHI)
Mercurity Fintech Holding Inc. (MFH)
Conclusion
We are moving into the most positive 6 months of the year between November to April on average from 1950. Now is a good time to position for the next sector rotations and market rally. I submit after years of trading in the market that the best approach is to be open to market rotations and watchful of the Mega cap behaviors that can skew the corporate indices in one direction while the broader market is moving in a different direction.
I wish you the very best in your trading decisions, and I trust this will benefit your investments as we get ready for another exciting new year!
JD Henning, PhD
Editor’s Note: This article covers one or more microcap stocks. Please be aware of the risks associated with these stocks.


