
Summary
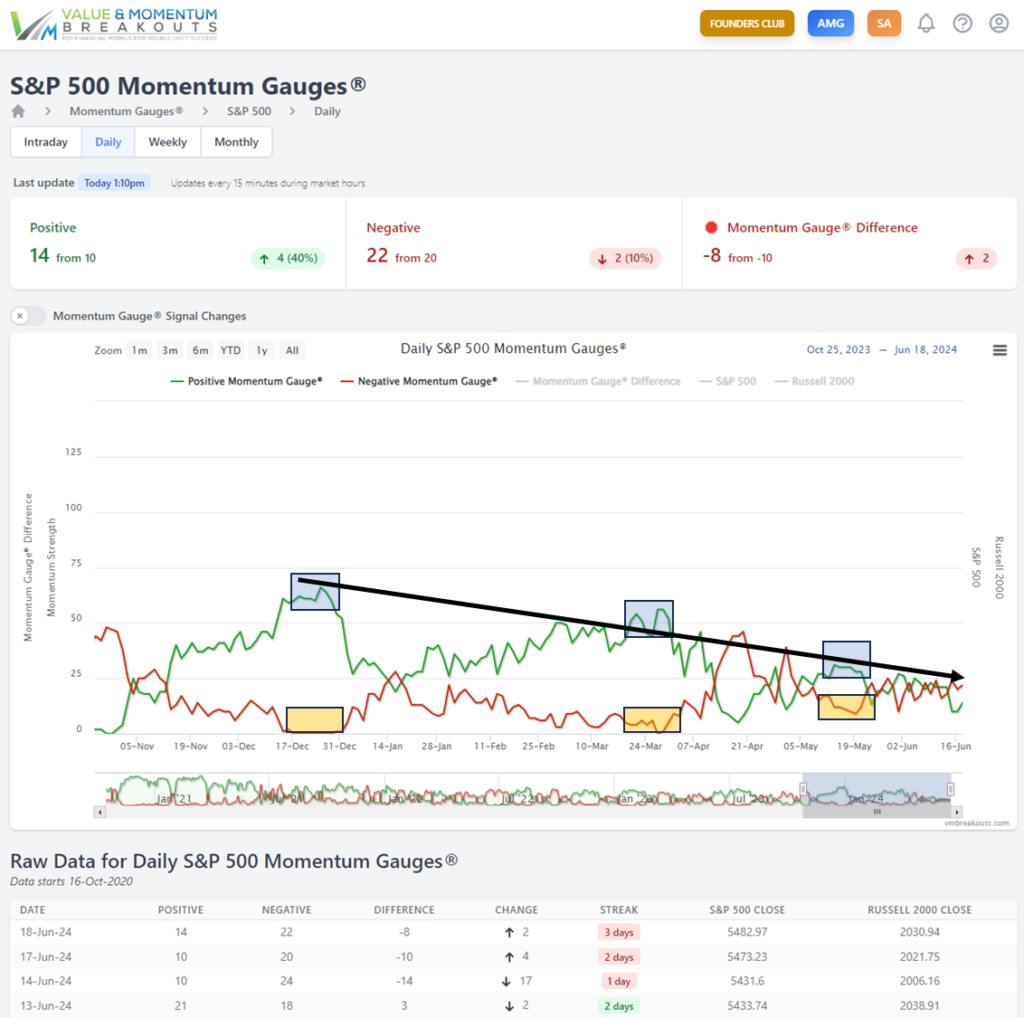
- Daily Market and S&P 500 gauges turned negative last week with and continue with more than three consecutive days of declining momentum.
- S&P 500 Mega Cap 8 stocks are approaching the highest Price/Sales valuations since the 2022 market decline.
- S&P 500 reaching all time highs but with more stocks at 52 week lows than highs for only the second time in 40 years.
- Weekly Momentum Gauges on track to turn negative this week with Wednesday/Thursday early signals and four consecutive weeks of rising negative momentum.
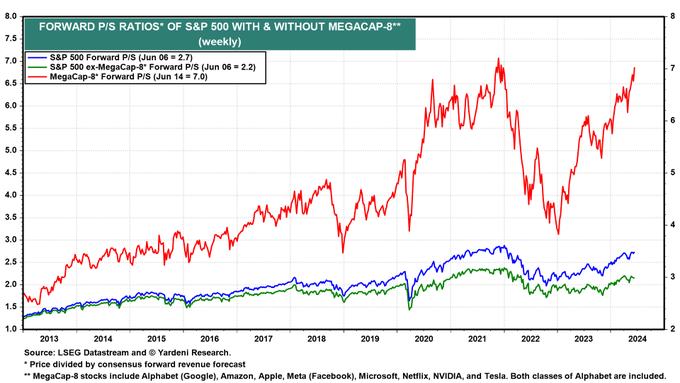
S&P 500 price/sales ratios
The S&P 500 stocks are approaching the highest valuation levels since the market peaked in 2021. The 8 largest mega caps have an average P/S ratio of 7.0, while the entire S&P 500 has a P/S ratio of 2.7. NVIDIA by comparison became the largest market cap stock in the world today and has a P/S ratio of 41.8 far above the largest stocks in the market and the S&P 500 average of 2.7.
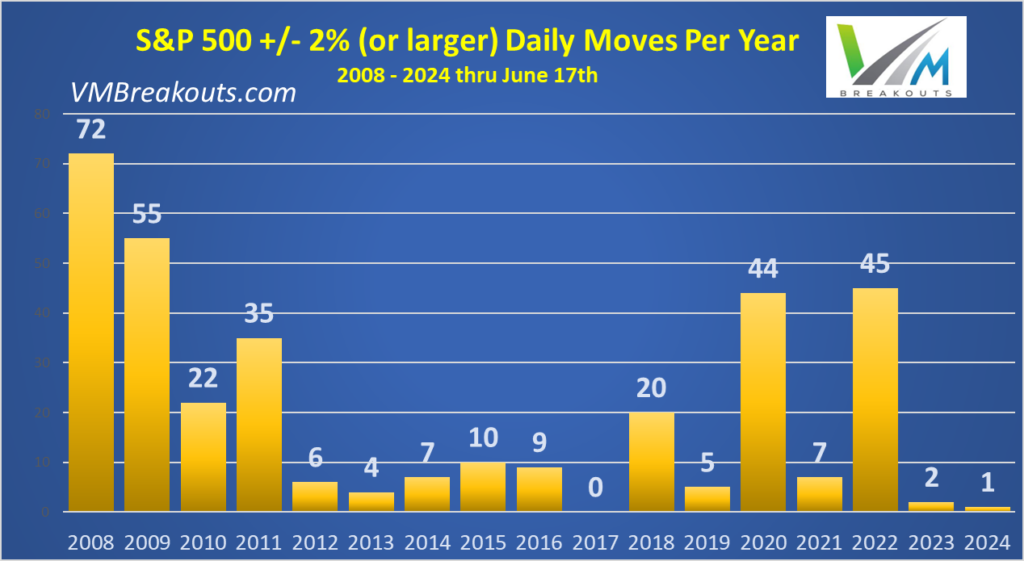
Related to the Mega Cap 8 chart above the S&P 500 +/- 2% daily volatility chart below shows that current volatility is the lowest since 2017. In all the recent years with low volatility the concentration of gains in the Mega Cap 8 stocks was the highest at the time. In the largest market declines from peak Mega Cap 8 levels on the chart above, the volatility on the S&P 500 spiked with 20 large moves in 2018, 44 moves in 2020, and 45 moves in 2022 as shown below.
@LanceRoberts highlighted today that we are seeing the first cluster in approximately 40 years where more stocks are hitting 52-week lows than highs over the past 10 days.
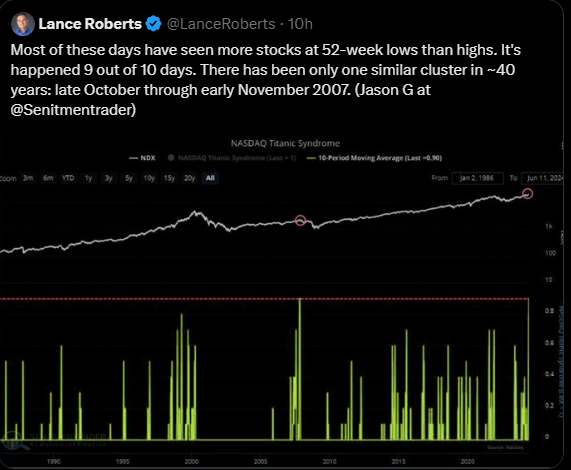
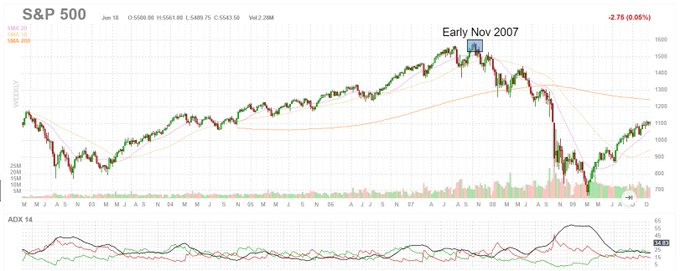
This anomaly corresponds to only one other time period back in October to November 2007. I have captured a snap shot of the S&P 500 runup to the 2007 peak highlighted by the current anomaly. We all know about the Global Financial Crisis that followed in 2008, but we cannot be certain that correlation means causation as another forecast based on this unusual event today.
What I can tell for the S&P 500 gauges this year is that there is an ongoing dampening effect of positive momentum that could lead to higher negative momentum conditions. As I indicate on the overlay of the daily S&P 500 gauges below, there is a clear pattern from the strong positive November 2023 breakout of a series of lower positive value peaks in March, May, and June. Similarly there is a rising trend of higher negative momentum values corresponding with those market peaks that could lead to higher negative MG values in a larger selloff pattern in the days ahead.
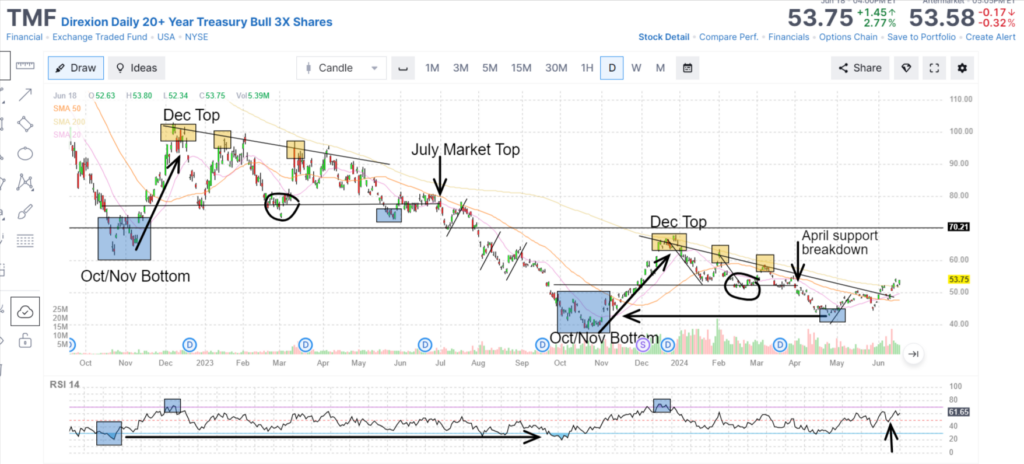
In the Bond Bull fund (TMF) we have seen strong similarities since October 2022 market lows that appear to be repeating through 2024. It will be interesting to test if there is another July market top next month as conditions appear to be priming for some profit taking and some reversions to the mean on volatility and market valuations.
Continue to follow the Market Gauges and watch with me if the Weekly and Monthly gauges also support negative signals in the coming days.
Wish you all the very best in your trading decisions!
JD