

Introduction
This article updates my outlook for 2024 with the latest Momentum Gauge® signals and a revisit of the January Investing Experts Podcast interview with Rena Sherbill at Seeking Alpha. In my last update for April we shared the bearish Mega Cap signal that forecasted a -28% decline in the MicroSectors FANG+ Bull fund (FNGU) of the 10 largest market stocks. I am pleased to share this article today with a much more bullish focus for the third quarter. This article builds on our prior signal events shared here on Seeking Alpha since 2018 with more insights on how to benefit from changes in the market momentum conditions.
Market Skew At Historic Levels
Regular readers of my articles and followers of my daily posts know that I have been discussing this incredible market skew and the similarities to the 2021 “market” index peak for many months. The main points of this signal article are as follows:
- Market Indices are quite different than the US stock market. Long time followers know that I often put “market” indices in quotes when discussing the three most popular corporate indices: S&P 500 (SPY) (SPX), Nasdaq 100 (QQQ), and the Dow Jones Industrial Avg (DJIA). These indices omit over 6,000 US and 10,000 OTC market stocks while overlapping on fewer than 600 of the largest stocks traded on the US exchanges.
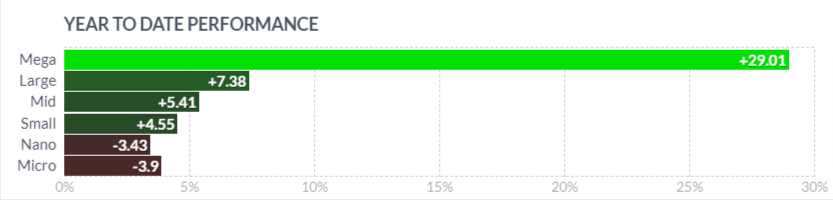
- The current mega cap skew is the highest divergence in history and the largest divergence between S&P 500 market cap/equal weight (RSP) since the 2008 Global Financial Crisis.
- Trillion dollar outflows this past week from the mega cap giants began flooding into the broader market of over 6,000 stocks not tracked on the major “market” indices in the strongest breakout signal since July 2022.
Broadest Stock Breakout Since November 2023
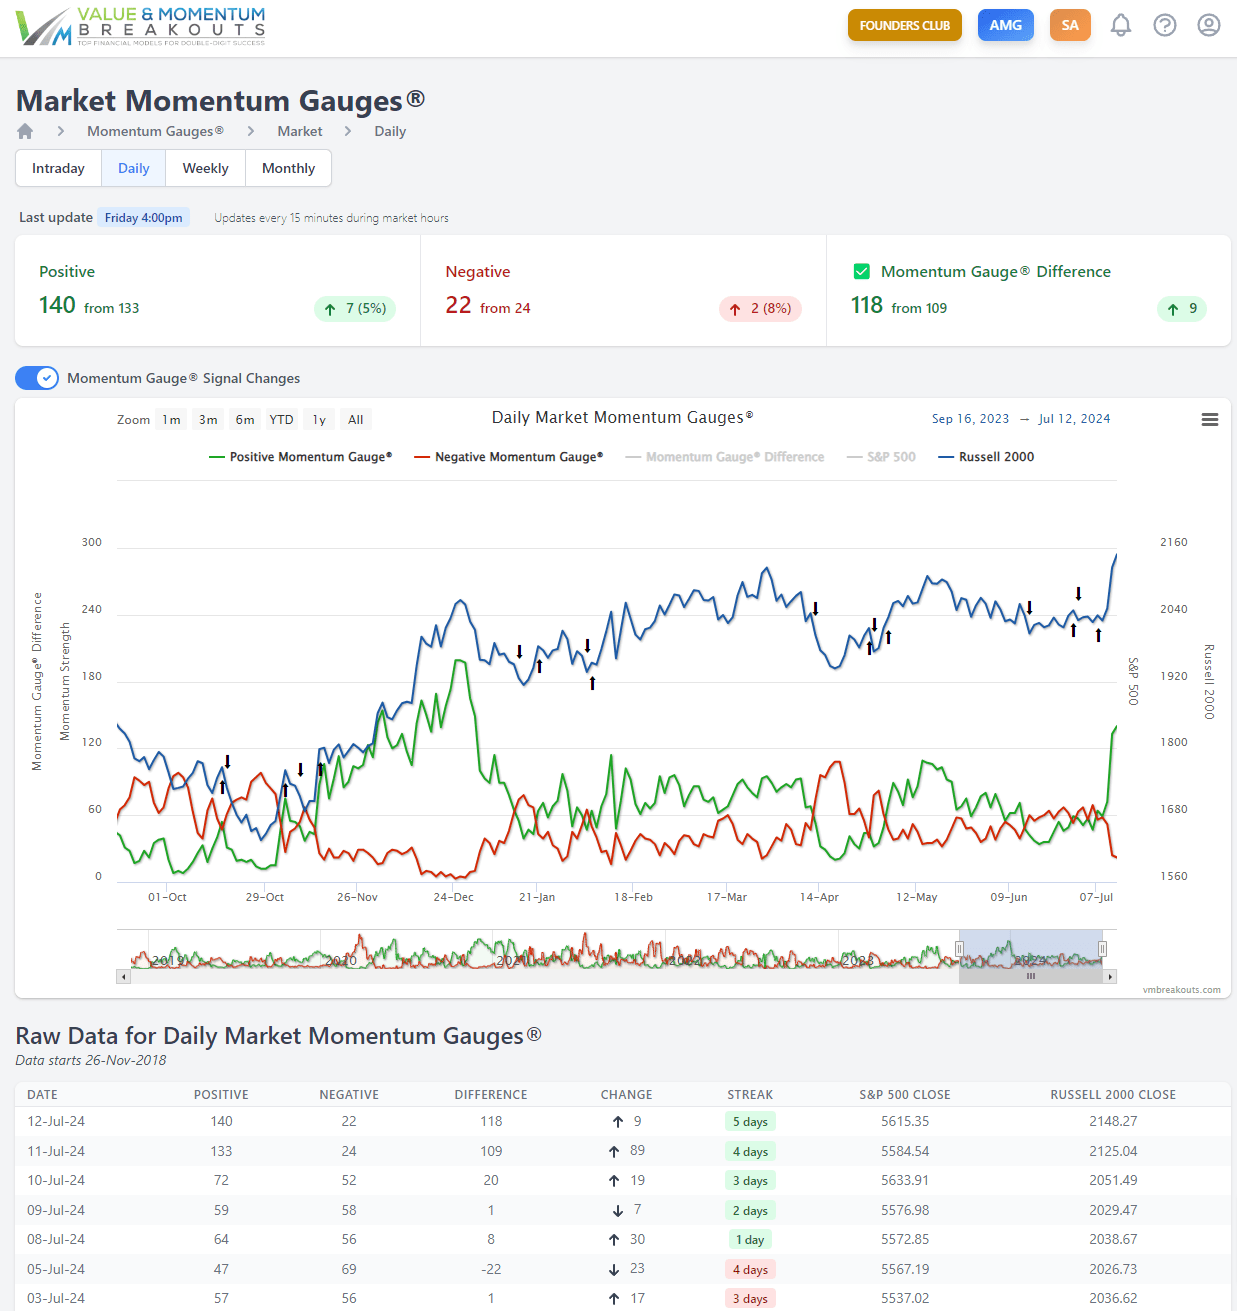
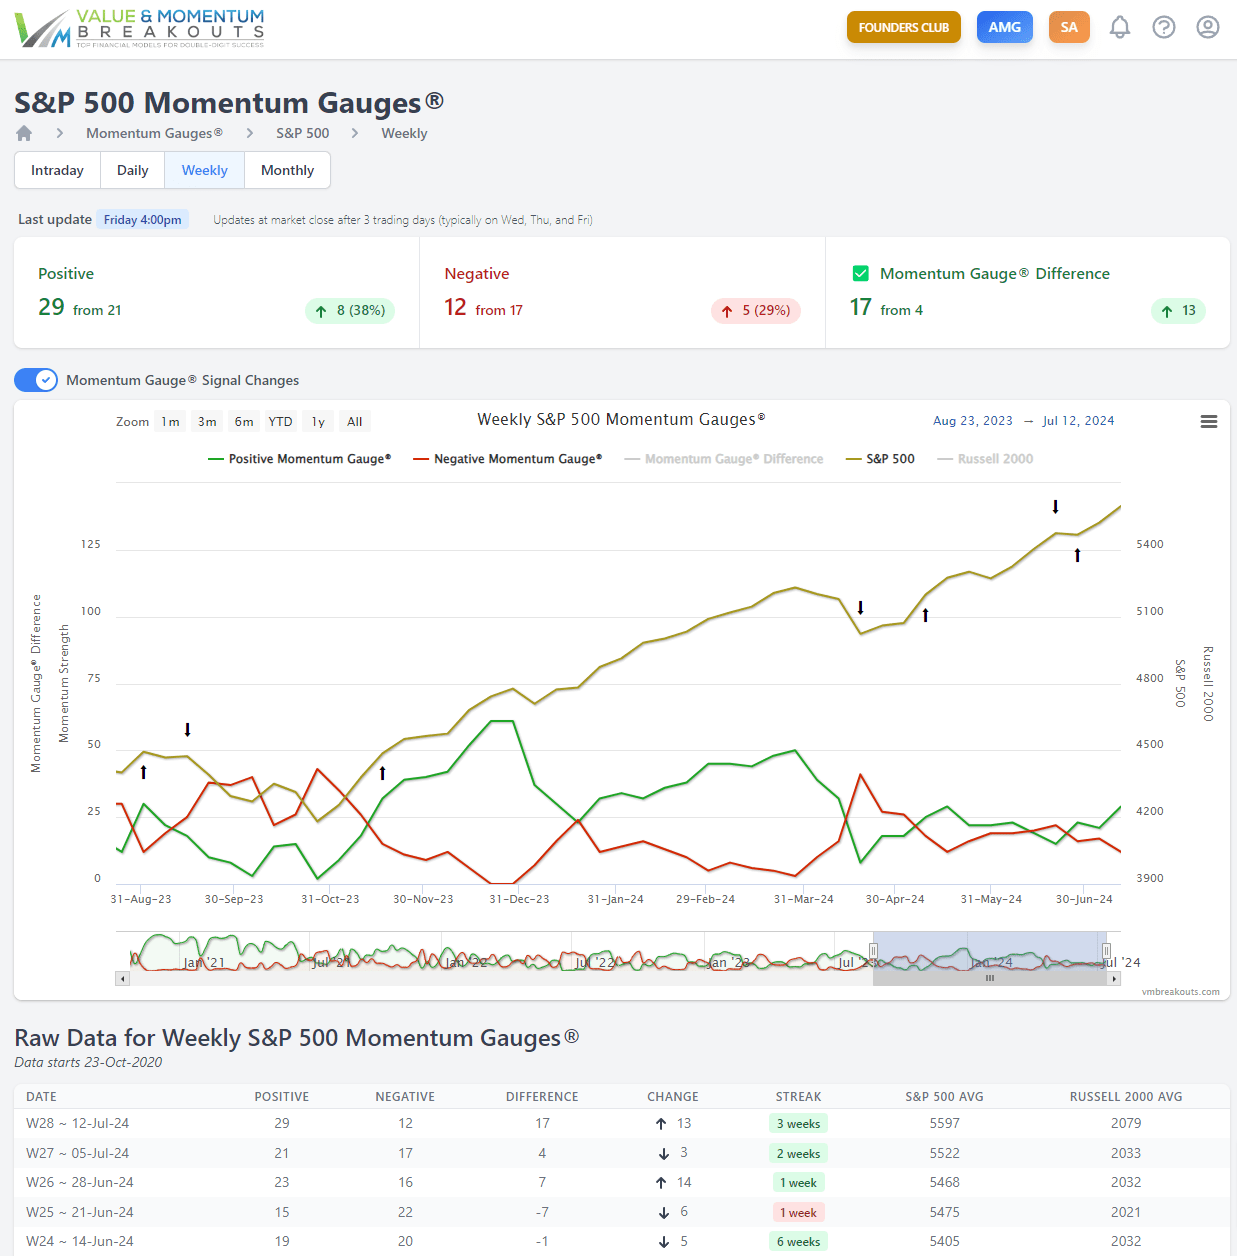
Let’s begin on the most positive note and explore my key points above in more detail. My daily Market Momentum Gauges of 7,500+ stocks across the entire US market based on my doctoral research of momentum theory shows a positive market signal on July 8th. The rise in the green line (positive momentum) from the June 18 lows rapidly escalated to 146 points intraday closing on Friday at 140 level. In a condensed format this means:
- More stocks in the US market are participating in Segment 6 positive acceleration conditions than at any time since the November 2023 rally.
- This is the largest 3 day increase of 117 points on the momentum scale since July 18, 2022. The prior record signal two years ago delivered a 139 point momentum gain leading to an 11.2% gain in the Russell 2000 and a 9.3% gain in the S&P 500 over a 21 day period. See charts below.
- While these signals have strong reliability it remains to be seen how long such positive momentum can sustain.
Current positive Market Momentum Gauge breakout chart
The daily market momentum gauge chart from October 2023 lows shows the extremely strong breakout signal at the end of October with confirmation through November. This signal led to a +20.5% gain in (IWM) Russell 2000 index to the peak on December 27th as shown below.
Value & Momentum Breakouts – Top Financial Models for Double-Digit Success
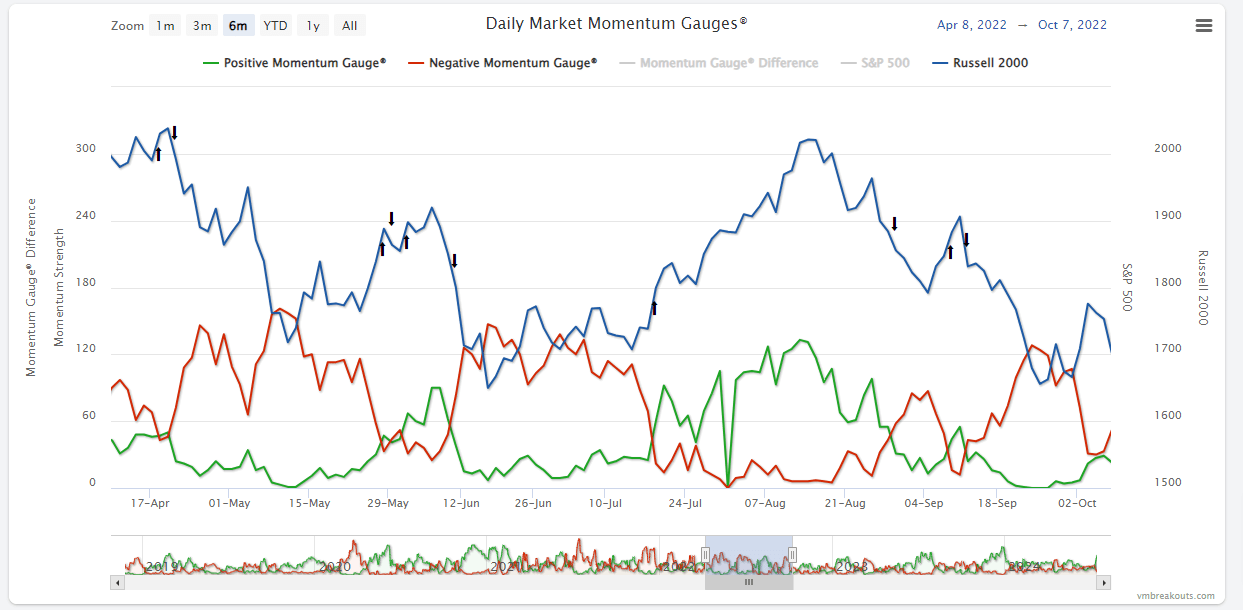
Prior positive Market Momentum Gauge breakout chart July 2022
The largest prior recorded breakout signal on July 18, 2022 was also extremely positive for the small cap Russell 2000 albeit short lived with a subsequent decline to September lows. This summer cyclical pattern is also highly consistent with market patterns since 1928 and especially strong during election years as detailed later in this article with September averaging the worst month of the year.
Value & Momentum Breakouts – Top Financial Models for Double-Digit Success
How does this relate to the Mega Cap skew?
By now you have read and heard ad nauseum about the Magnificent 7 stocks (AAPL)(MSFT)(NVDA)(GOOGL)(AMZN)(META)(TSLA) that have propelled the “market” to record index highs in one of the most incredible rallies in modern times. My own dozens of articles and posts have covered this phenomenon in great detail. As I shared in the Seeking Alpha podcast from January,
The thing to consider is that we rarely EVER see market leaders from the prior year be market leaders for the coming year. ~ JD Henning, January Podcast
Callan Institute
And by that, I look at the Magnificent Seven over the past two years, they’re back to where they were in 2022 at the peak and they had quite the ride. ~ JD Henning, January Podcast
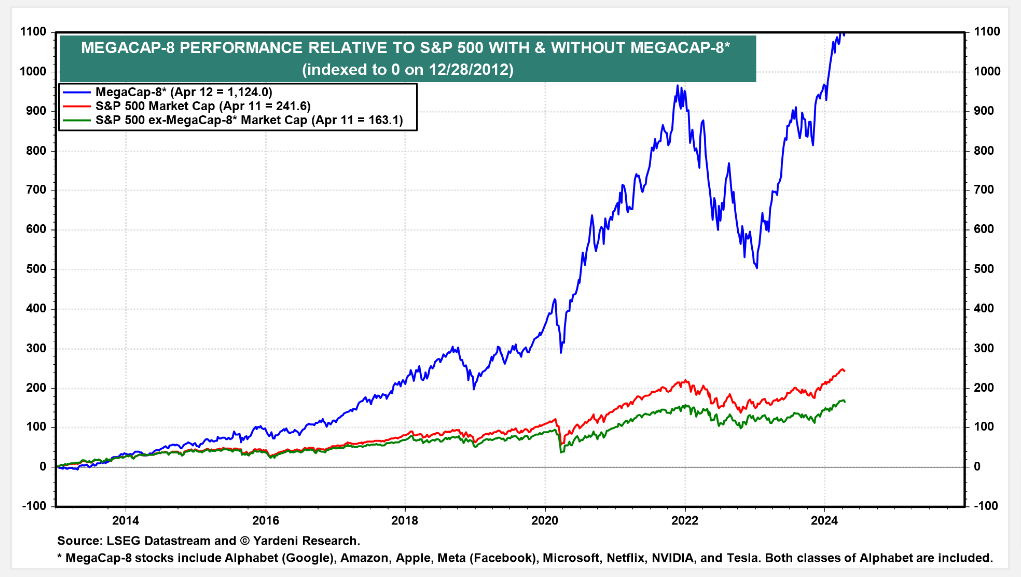
These seven stocks representing $16.46 trillion in market cap are the most overweighted stocks on the major “market” indices. This overweighting causes an enormous skew illustrated above relative to the rest of the S&P 500 stocks. The skew is even more extreme relative to the broader market when you consider that just a portion of the seven Magnificent mega cap stocks have a larger market cap than the entire Russell 2000 small cap stocks combined.
In fact, if not for the large +5.98% returns just this week in the small cap Russell 2000, the small cap index would still be negative for the year and from the December 2023 peak.
Finviz.com
Why does this Mega Cap skew happen?
I have many theories about why this Mega Cap skew occurs and how each time trader sentiment and attitudes are remarkably similar. I have discussed this in much more detail in prior articles and podcasts, but I will just summarize it to two points:
- Mega cap giants have strong balance sheets, enormous global footprints to weather country/governmental risks, and a perception of “Too Big To Fail” in a chaotic world since at least the Global Financial Crisis.
- When investors are most fearful and institutional money managers most risk averse, it is easiest to crowd into the largest and “safest” stocks in the market.
- Frequent losses in smaller and more speculative stocks over time create a herding behavior among investors moving to larger and safer stocks to limit the pain caused by riskier trades.
Value & Momentum Breakouts – Top Financial Models for Double-Digit Success
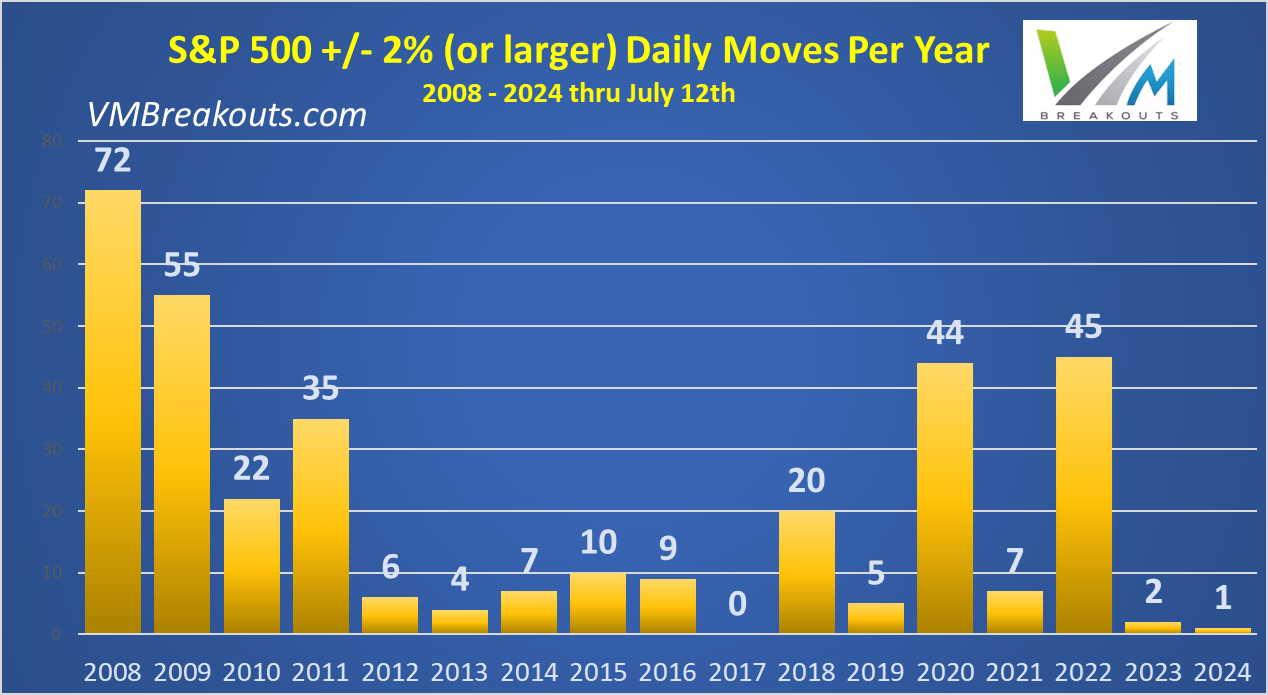
There is much to discuss in the volatility chart above that I track of the S&P 500 since 2008 relating to QE/QT, Fed balance sheets, and market flows. Again I will keep it short and you can review my prior detailed discussions on this.
The one main takeaway right now is that we are in the longest stretch without a daily -2% S&P 500 market decline since 2017. That means, not only of the fewest +/- 2% daily S&P 500 moves since 2017 — but we have not seen a -2% decline since February of 2023 approaching a year and a half in the longest stretch in 8 years.
I am frequently asked,
Is the stock market really this calm? What does this mean, how come I keep seeing large moves in stocks sometimes with huge declines?
The short answer is no. The markets are not particularly calm. Yes the “market” indices are calm, but that excludes thousands of smaller stocks. These extremes of low volatility on the S&P 500 index are being created by the enormous concentration into the most overweighted SPX index stocks that have been extremely steady and profitable since the lows of 2022.
FinViz.com
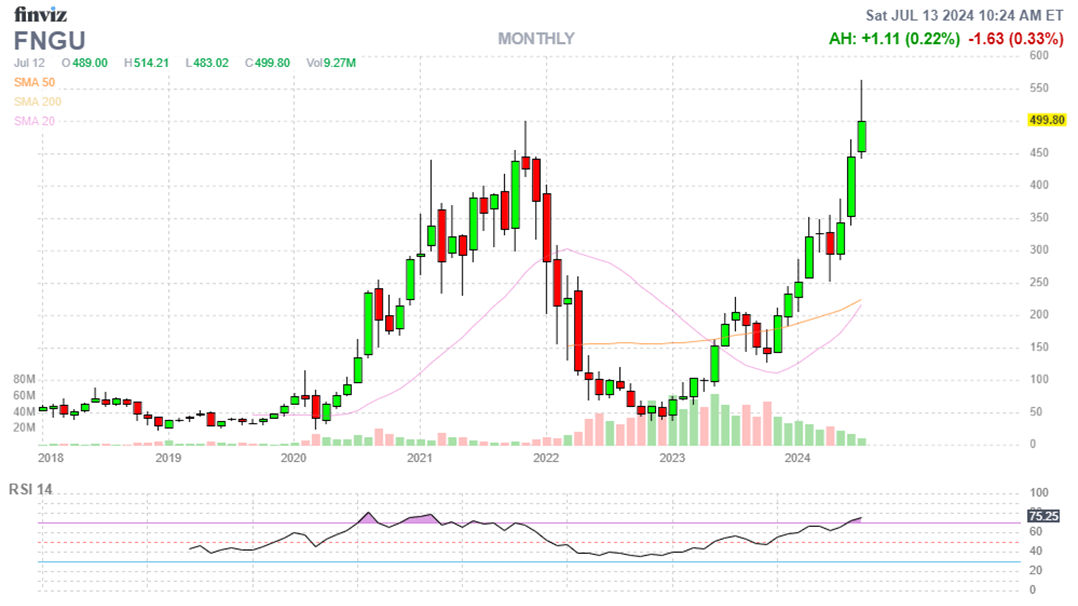
One of my favorite funds to trade and to illustrate these effects is the MicroSectors FANG+ Index 3X Leveraged ETN (FNGU) of the 10 largest mega cap stocks. You can see the massive swings from back in March 2020 at the start of QE 4 stimulus and subsequent quantitative tightening. You can also see since the passage of the CHIPS and Science Act in the second half of 2022 there has been a record move in these Mega Cap giants led especially by Semiconductors (SOXL) like NVIDIA (NVDA), Broadcom (AVGO), Advanced Micro Devices (AMD) and Qualcomm (QCOM) to name just a few.
 FinViz.com
So my theory is that while the Federal Reserve continues to battle against inflation and cool down inflationary economic forces by hiking rates to the highest levels in over 23 years, reducing money supply, and tightening their balance sheet there is one particular anomaly.
FinViz.com
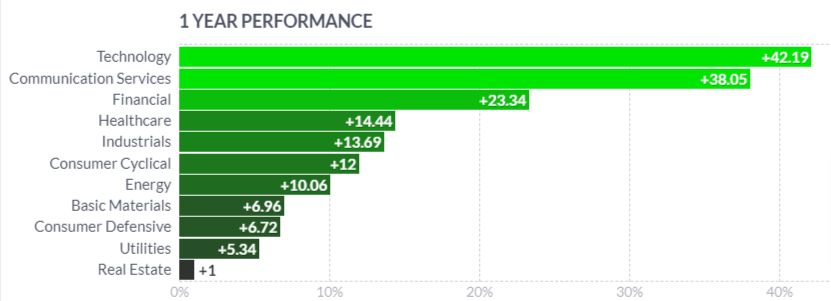
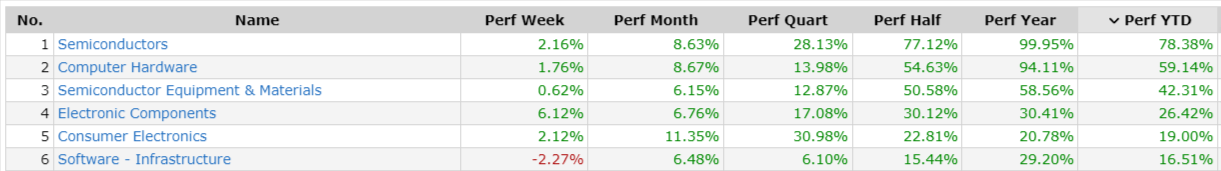
As the table above shows, this anomaly contributes most to the performance skew in the markets that we see in the Technology sector, both the largest and most heavily weighted sector on the indices. The largest component of this mega sector is semiconductors that are benefiting greatly from hundreds of billions of dollars from the CHIPS act, but even more significantly, a massive tax credit… up front.
the Advanced Manufacturing Investment Credit, a 25% investment tax credit for companies engaged in semiconductor manufacturing and production of manufacturing equipment… The Department of the Treasury also released a proposed rule in June 2023 to allow companies to receive the full amount of the Advanced Manufacturing Investment Credit as a direct payment from the Internal Revenue Service.” – U.S. Department of the Treasury
Where the money flows, the market grows. This skew is one for record books and we will look at it next in more detail.
How big is this mega cap skew?
In one of the clearest illustrations I can show, the ratio of the equal weighted S&P 500 stocks to the market cap weighted S&P 500 stocks is now the lowest we have seen since 2008. This skew toward the “safest,” largest, and best performing stocks in the market is now more pronounced than during the Covid Pandemic and approaching peak concentration levels of the 2008 Global Financial Crisis.
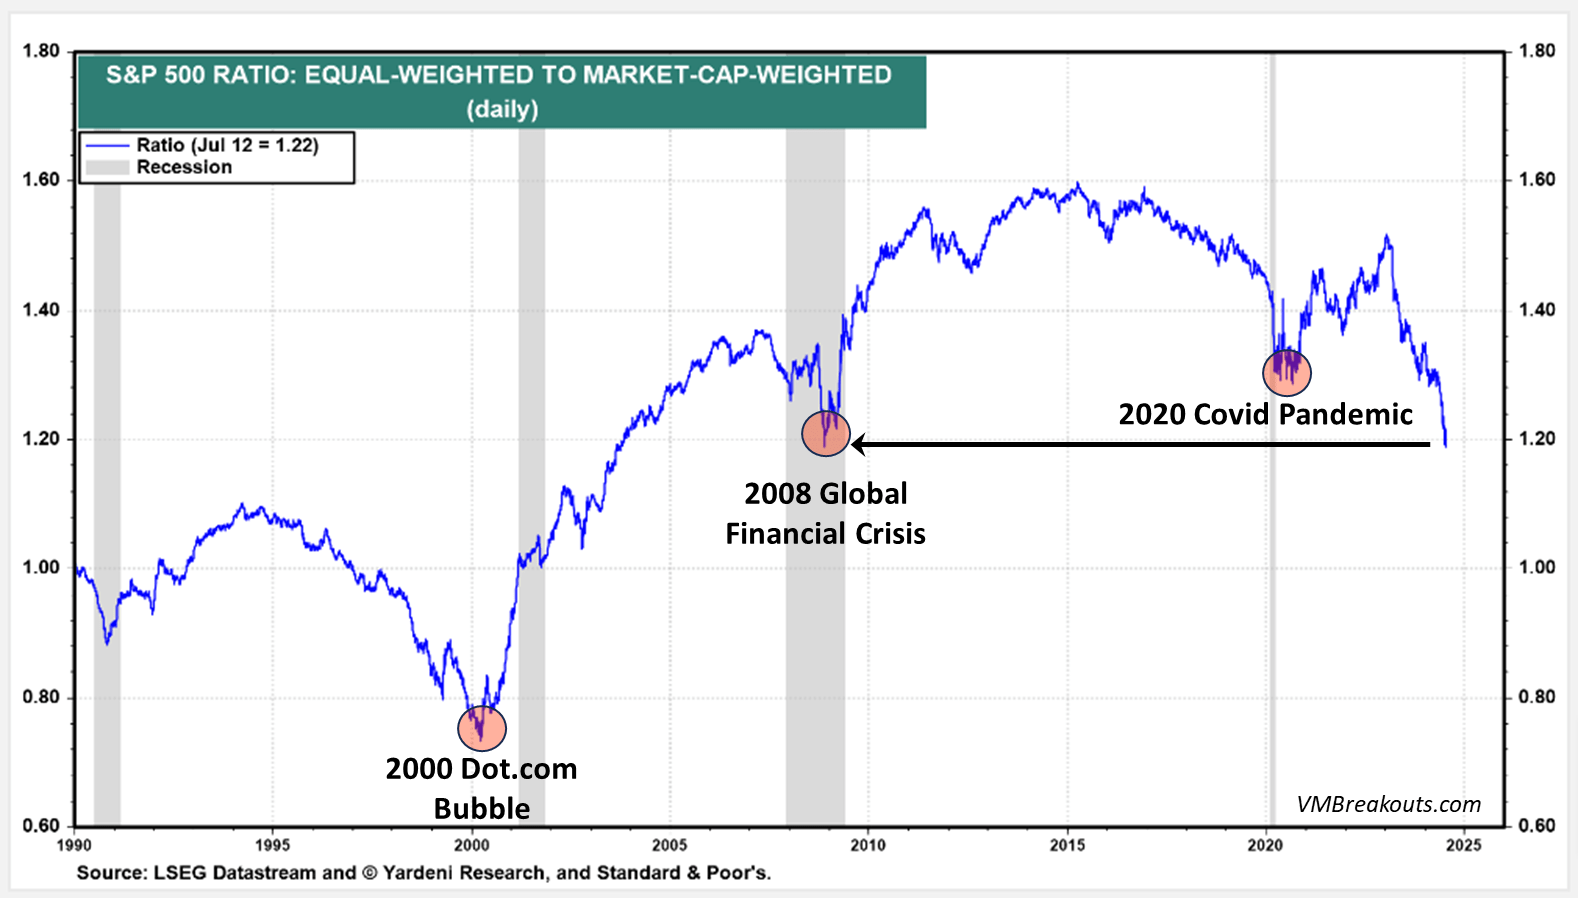
Yardeni.com
The chart above does not mean that the momentum into the Magnificent 7 mega caps is over. Rather, it suggests that a broader participation from the rest of the S&P 500 stocks and the thousands of smaller stocks is extremely overdue.
The biggest money managers know this and they started a large rotation this past week to the most shorted, oversold, under-valued, out-of-favor stocks and segments that we have seen on the Momentum Gauges in 2 years, so far.
Does this mean we will have a market correction?
No, in fact forward earnings relative to price are at some of the best valuation levels for the S&P 400 / S&P 600 largest stocks that we have seen in over 22 years.
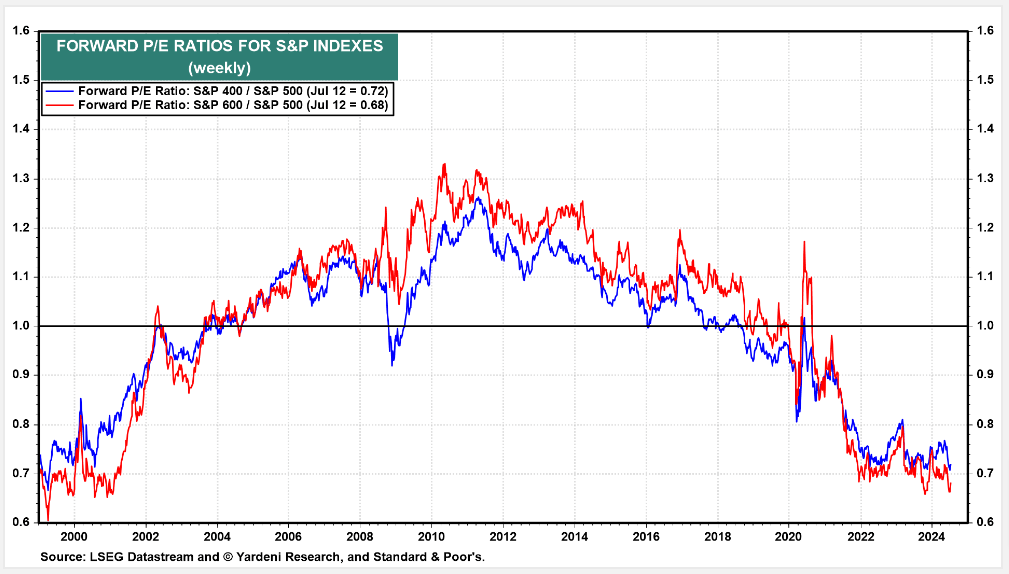
Yardeni.com
If you are still tracking with me, this means that beyond the best performing 10 mega cap stocks are hundreds of good value stocks in the S&P 500 and thousands more in the broader market. As investors sense that conditions are safer to spread out from the most concentrated stocks, we could see broad market gains increase significantly.
However, if you define the “market” as the corporate indices of the 630 overlapping largest cap stocks there could be a large downturn in these indices when the enormous stimulus and tax benefits of the CHIPS act have run their course.
The Good News
What we saw on Thursday last week and in the Momentum Gauge signals from July 8th was the initial exuberance that it may be safe soon to come out of the record crowding into the Magnificent 7 again and start finding good bargains. The CPI inflation rate MoM delivered the first decline since May 2020.
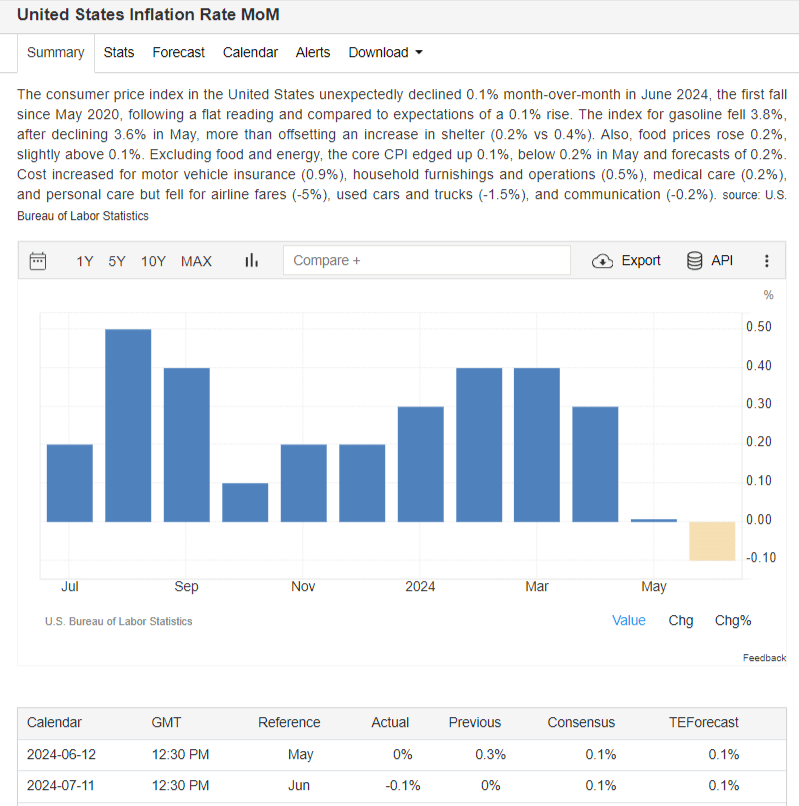
Tradingeconomics.com
This excitement may largely be driven by the hope that inflation may finally be under control after years of hearing “transitory” bantered about from the Fed and policy makers. For example, among my 10 different portfolio types offered to members we saw some of the largest weekly gains this year in the Piotroski Value stocks like Sphere Entertainment (SPHR) +24.5%, Growth & Dividend value portfolios, and even the July Negative Forensic portfolio +8.50% led by gains in SoundHound (SOUN) +57% for July. Even the most extreme “Zombie” stocks with high short floats saw major inflows and gains this week.
However, the best illustration comes from my weekly MDA breakout stocks tracked by max/min weekly returns with an overlay of the daily Momentum Gauge warning signals. You can clearly see in the strong positive momentum conditions of Q1 that each weekly return was significantly higher than in the negative gauge signals through Q2.
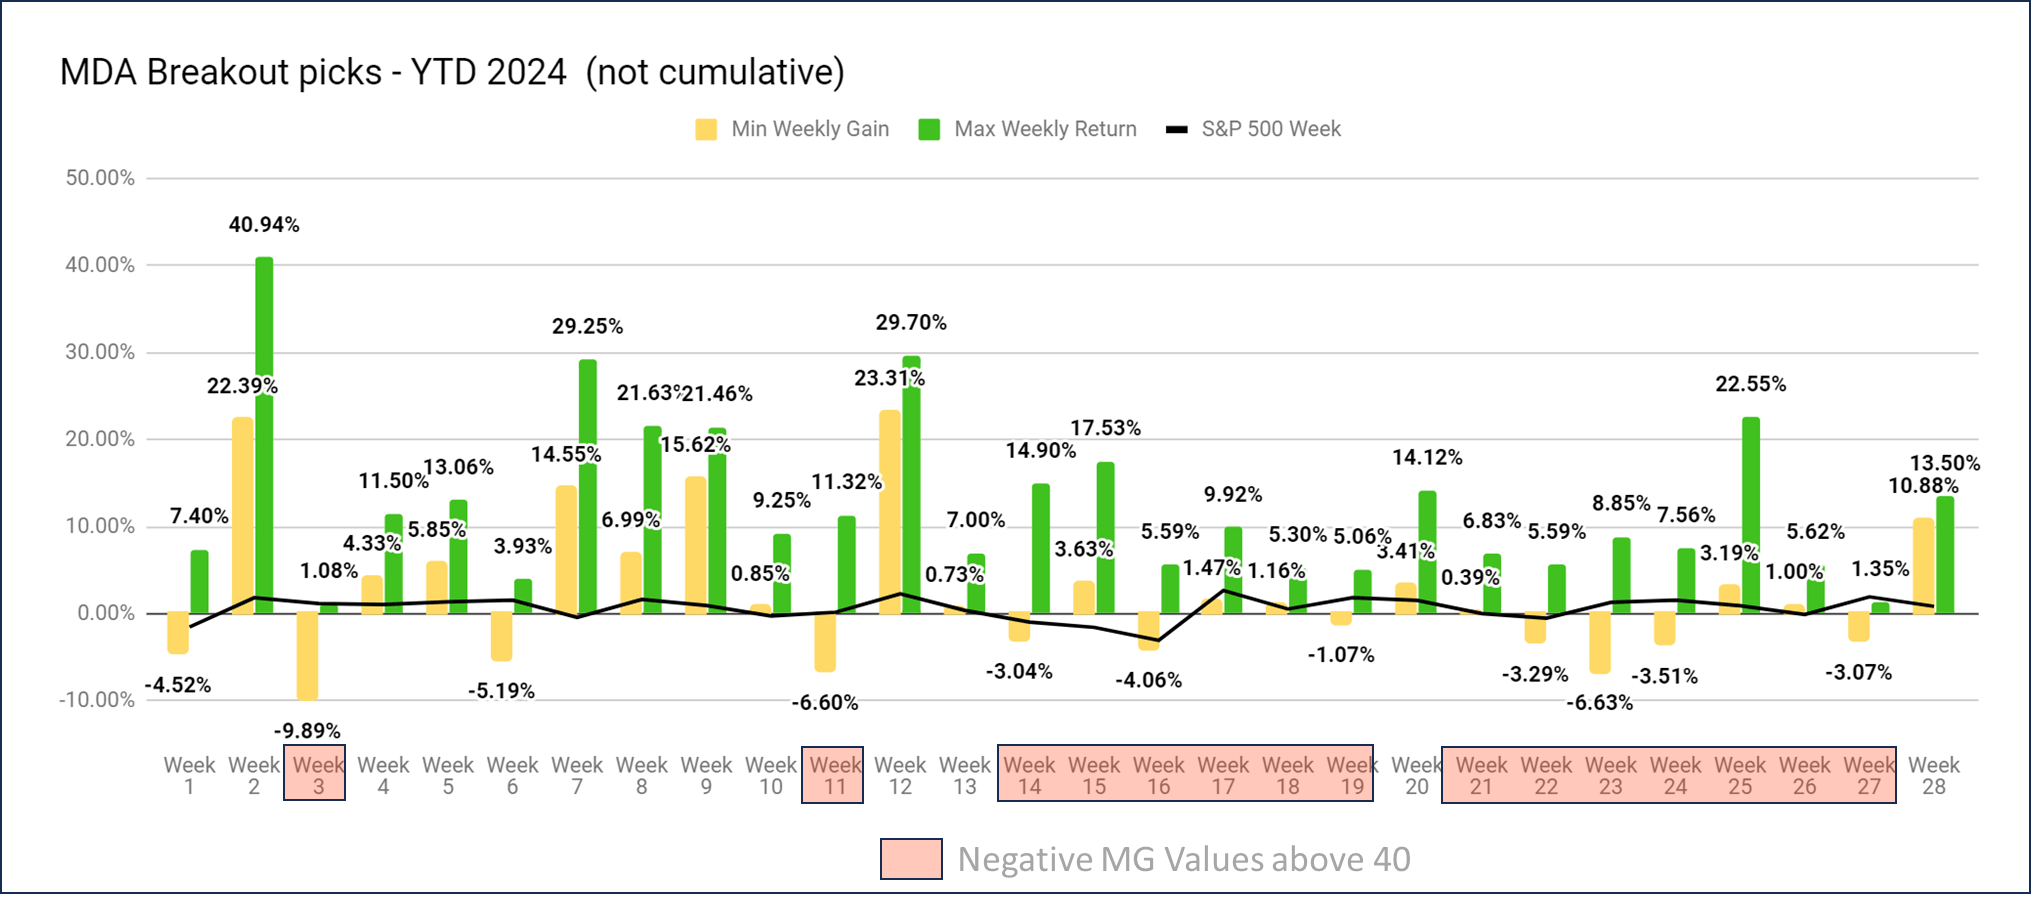
Value & Momentum Breakouts
Week 28 MDA breakout picks delivered minimum returns of over 10% this week for the first time since the positive momentum gauge signals in Q1. We have reached 186.59% gains YTD in a simulated portfolio adding the average weekly gains together of these small cap breakout stocks offered to members. For the past 371 trading weeks returns have reached +2,340.5% minimal cumulative returns as my MDA research continues live testing on Seeking Alpha every week in good and bad markets since 2017.
Nearly 100 years of S&P 500 Cycles
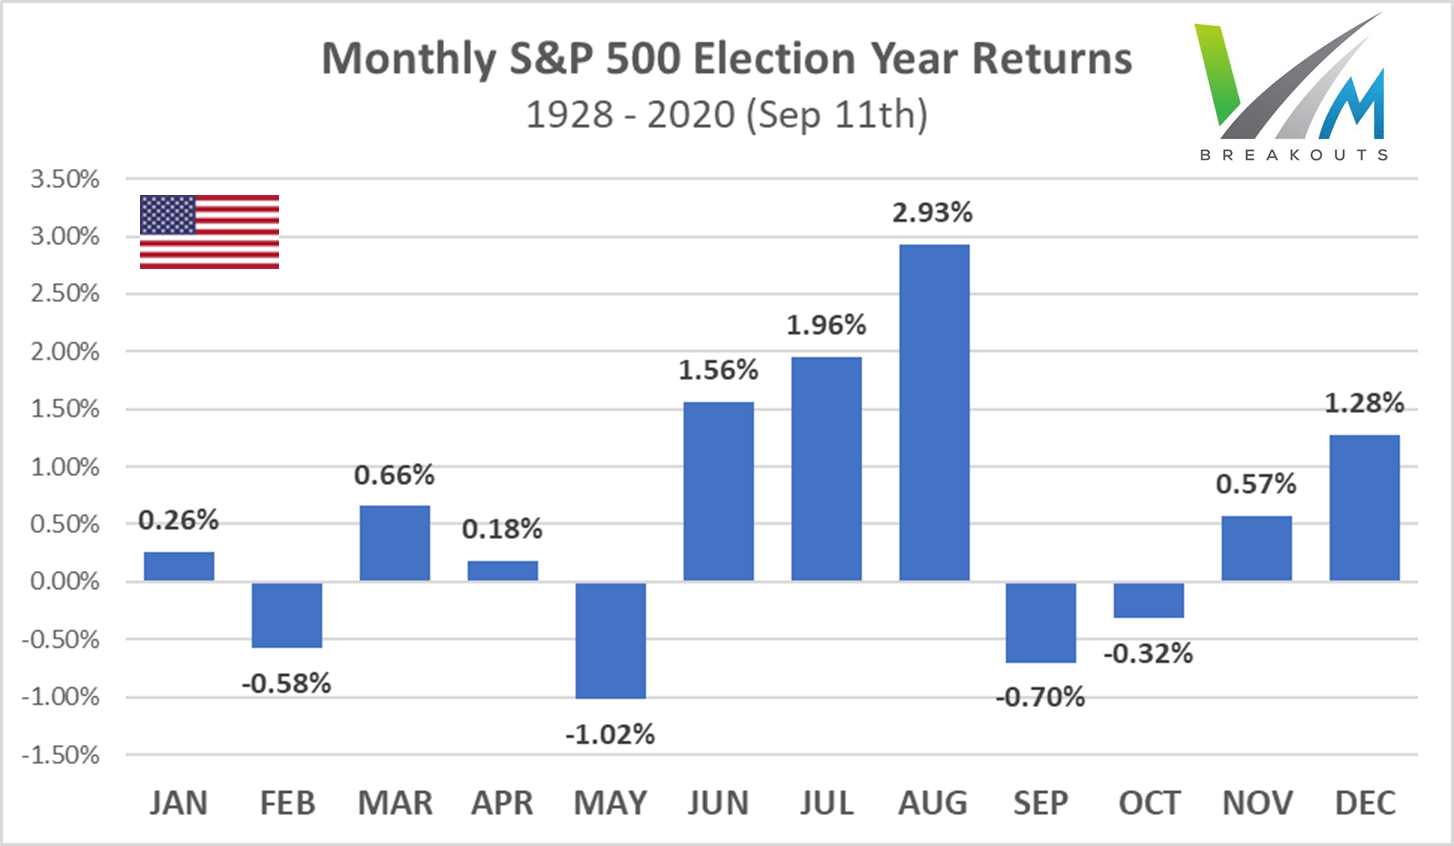
As I promised to detail from earlier in the article, this skew also fits into the strong positive summer cyclical rally patterns from 1928. As you can see below, and especially in the second chart, the summer pattern of gains is quite large in election years.
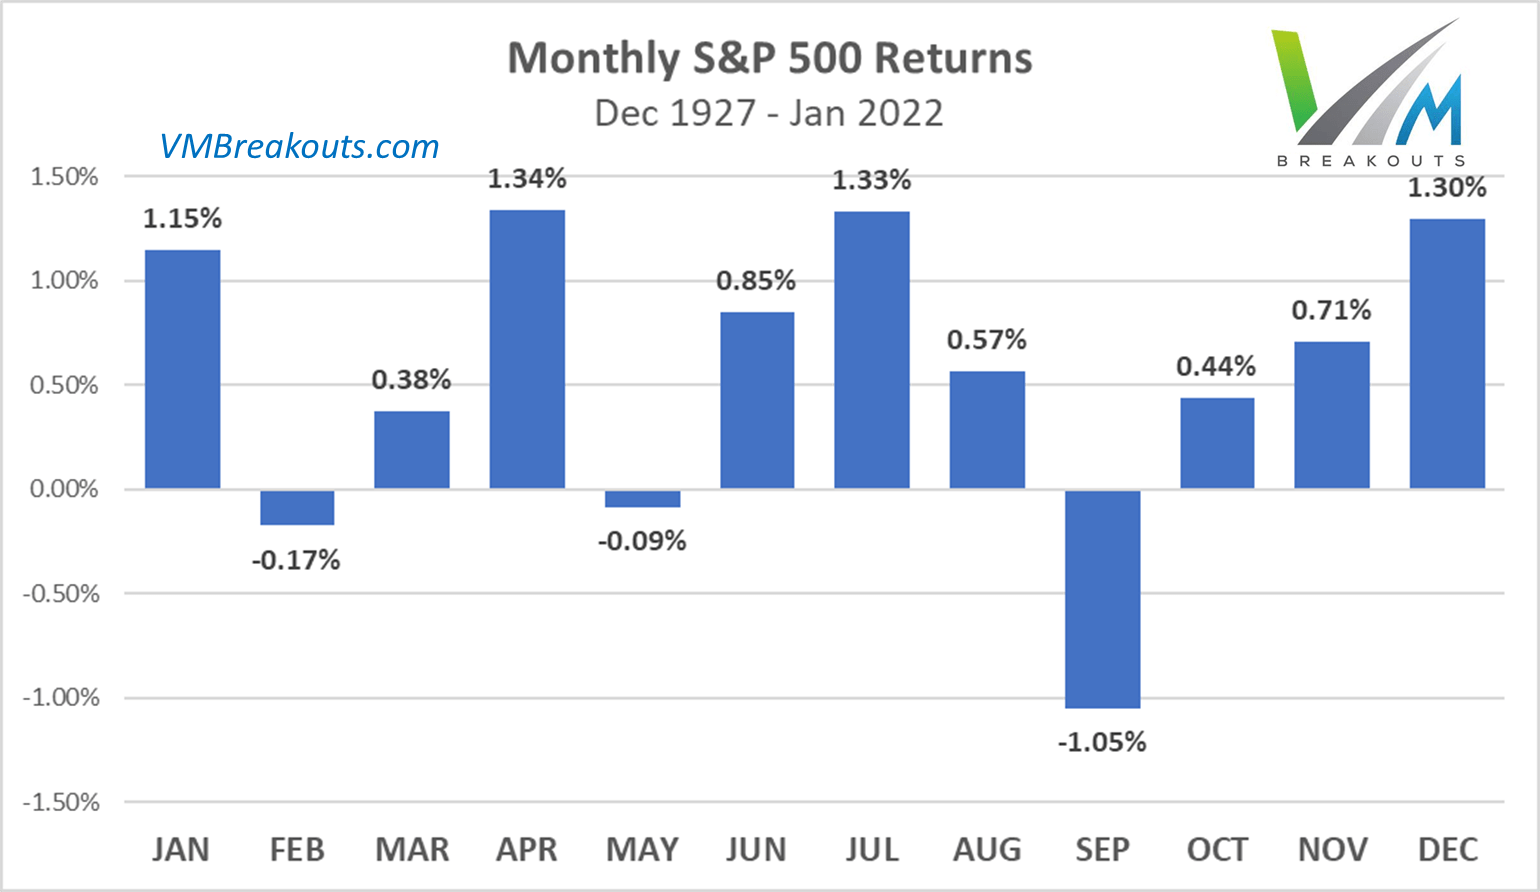
S&P 500 monthly returns from nearly 100 years of election year cycles.
Conclusion
The Momentum Gauges developed in my research are exclusively based on equal weighted patterns of momentum across the entire U.S. market, the S&P 500 index, and 11 separate sector gauges. This is particular effective for finding broad market changes not as evident on the corporate indices, but may lag index moves during periods of extreme skew.
Value & Momentum Breakouts – Top Financial Models for Double-Digit Success
Fortunately, we are heading into another positive weekly signal among the equal weighted S&P 500 stocks that may continue much higher even if outflows shift to the lagging 493 non-Magnificent 7 stocks with tremendous potential value.
As always, I wish you the very best in all your trading decisions and I hope this article benefits you greatly with many more updates to come!
JD


3 Responses
Yoou actually make it seem so easy with your presesntation but
I find this matter too be reallpy something that I thhink I would never understand.
It seems too complex and very broad ffor me. I’mlooking forward
for your next post, I wwill try to get the hang of it! https://Odessaforum.Biz.ua/
I think it is possible to understand the forces that are working on the market and watch to see if these conditions are confirmed. This article examines the large market forces and I have written another article to show more details for trading at a more granular level: https://vmbreakouts.com/articles/the-july-2024-mg-breakout-primer-on-bullish-stair-steps/
I was more than happy to uncover this page.
I wanted to thank you for ones time ddue to this
wonderful read!! I definitely savoreed every little bit off it and I have you bookmarked to see new things on youyr blog. https://myworldgo.com/forums/topic/98439/joy-casino-igrovaa-radost-i-udaca-na-poroge/view/post_id/1095561