

Summary
- Analysis of recent Momentum Gauge breakout signals and comparison to past patterns in small cap stocks.
- Investor behavior drives bullish stair steps as alternating periods of profit taking and dip-buying test the strength of new breakout signals.
- Comparison of November 2023 and July 2022 breakout signals, highlighting similarities and differences in market behavior.
- Examination of current July 2024 breakout signal, focusing on unique trends in S&P 500 and Russell 2000 stocks.
This is a just short article highlighting some classic investor behavior during bullish stair steps and how it may relate to current patterns in the market. While no two time-periods are exactly alike, investor psychology remains relatively constant and tends to repeat itself as investors test new signals.
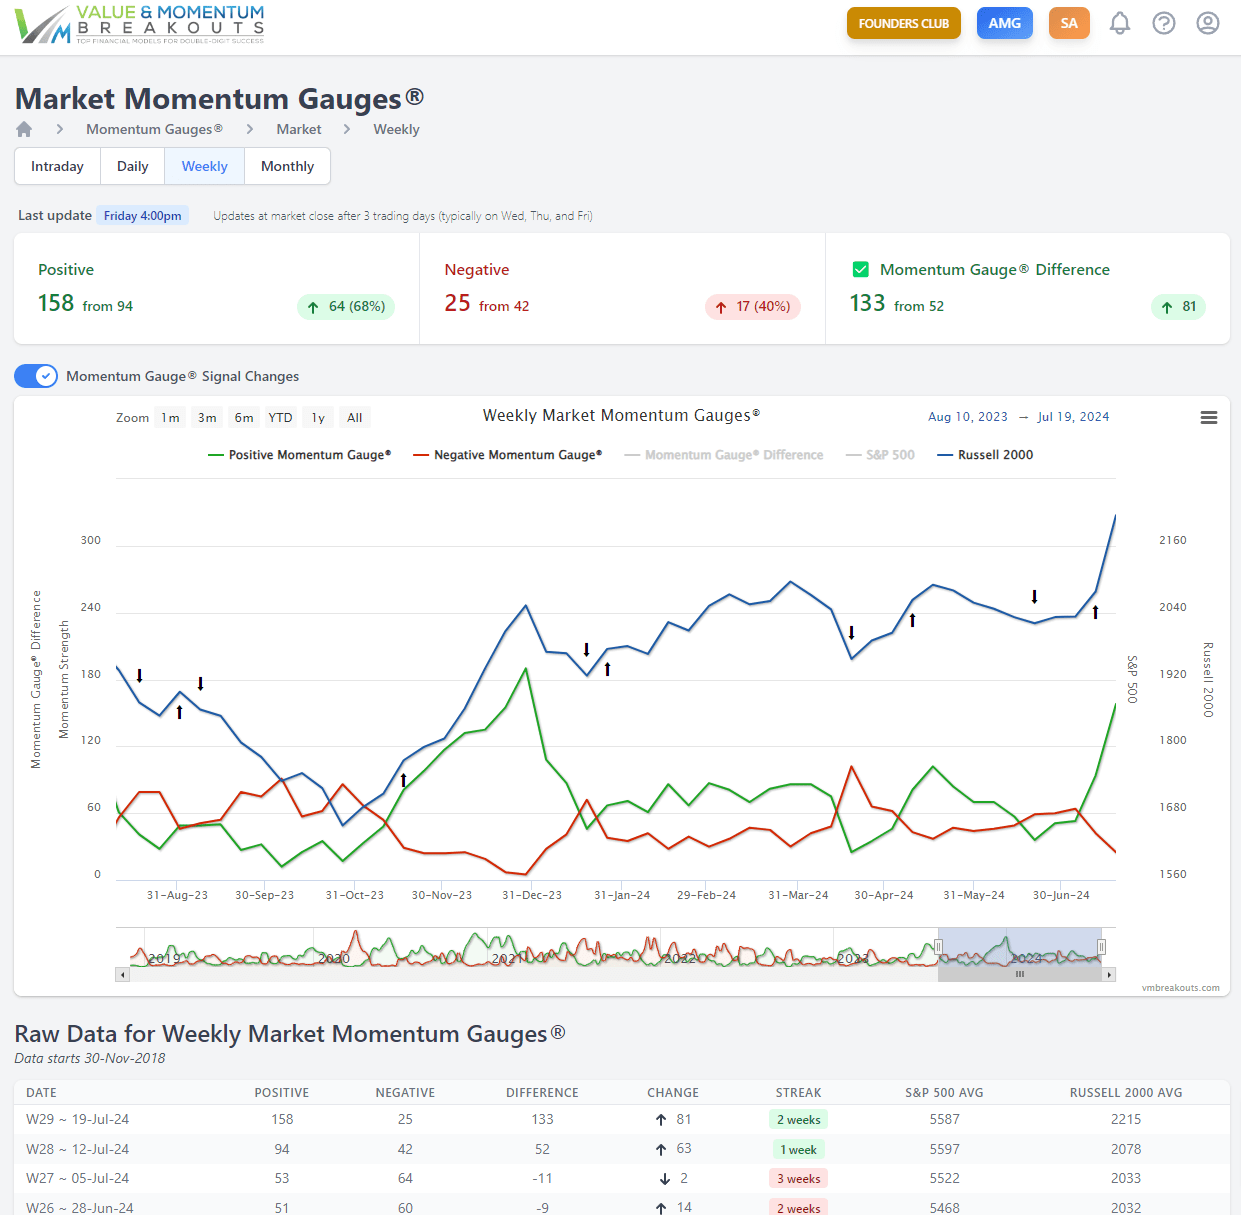
Current Weekly Momentum Gauge chart
As we all have seen over the past two weeks, the Momentum Gauges have started the largest breakout signal since November 2023 with daily gauges as positive as last July 2022 breakout. I certainly do not know the future and the best I can offer is an analysis of what these massive moves in small cap stocks have showed us before.
Value & Momentum Breakouts – Top Financial Models for Double-Digit Success
For this article I will be comparing the recent July 2024 signal to the November 2023 breakout conditions primarily driven by the small cap stocks that are needed to create such high positive momentum values. The Weekly MG chart above smooths much of the daily volatility and so I will show more granular charts to explore whether the bullish stair steps will continue again in this large breakout.
Analysis of the Daily Momentum Gauge charts
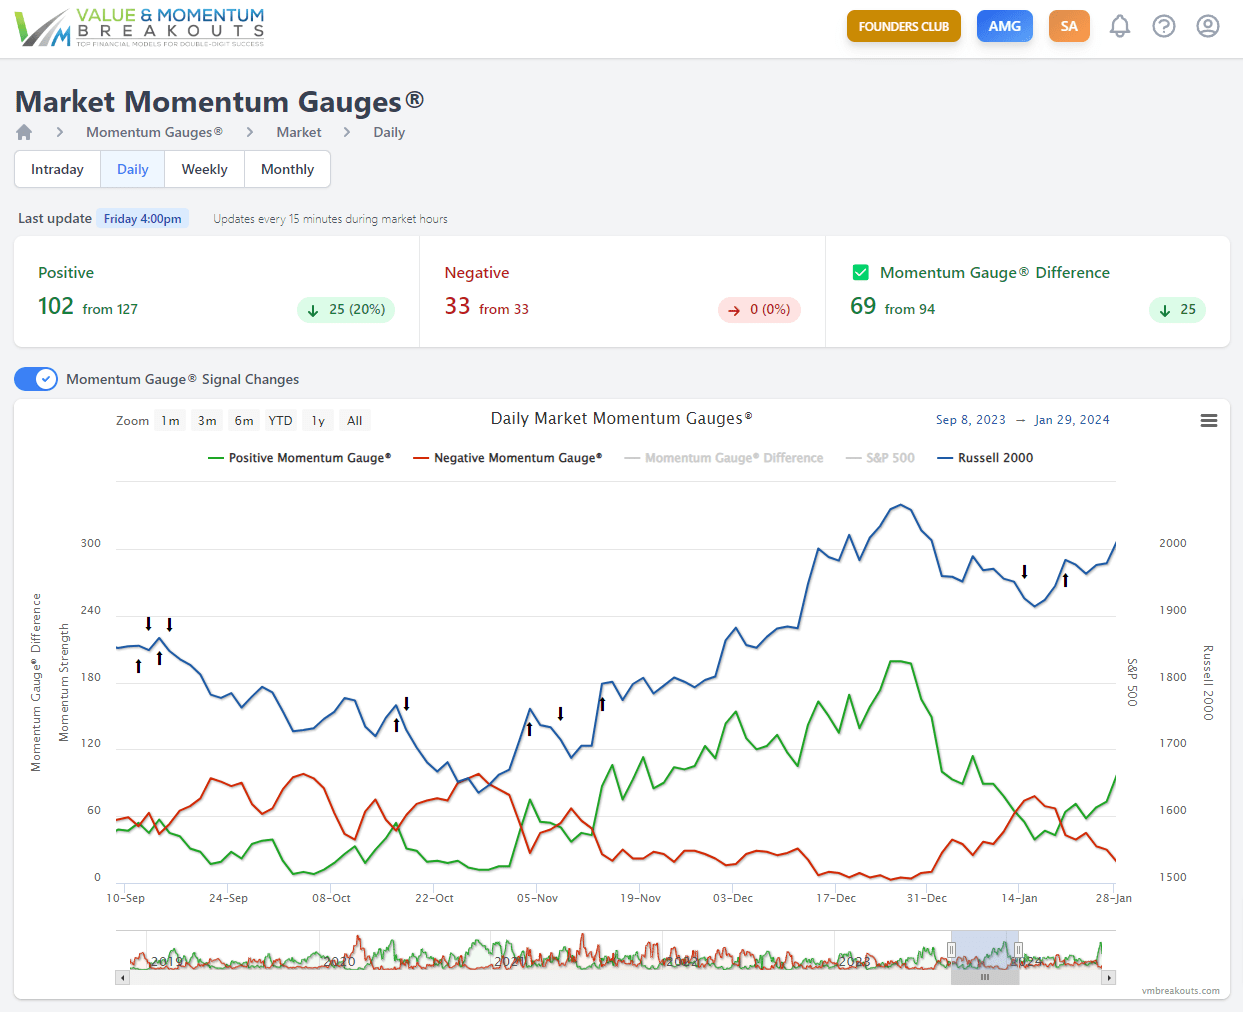
First, here is a glimpse back in time to the major November breakout signal on the daily MG chart. You can see clearly that the first big move into the Q4 January effect rally started in early November and was met with aggressive profit taking and a quick negative signal. The second positive signal in November came with more investor confidence and produced +14.9% gains in the Russell 2000 index to the peak on December 28, 2023.
November 2023 daily breakout signal
The Momentum Gauges back in November moved from positive 15 up to a peak of 199 positive for a total move of +23.7% on the Russell 2000 in a period of 31 trading days. In this same time period the S&P 500 gained over +6.6%
Value & Momentum Breakouts – Top Financial Models for Double-Digit Success
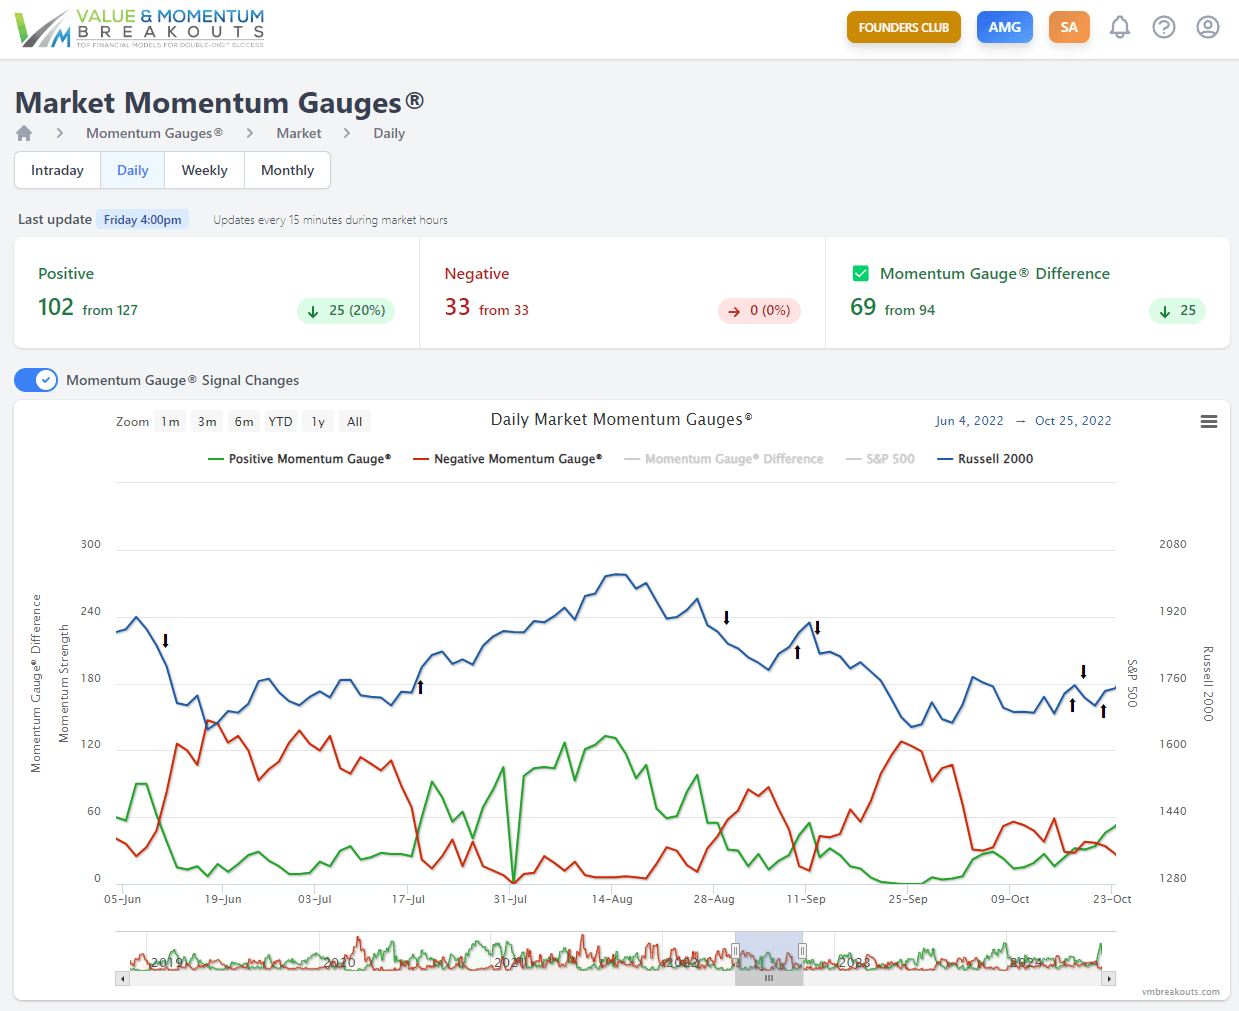
July 2022 daily breakout signal
Looking further back at the July 19, 2022 breakout that produced the largest momentum gains over a 4 day period since last week may give us a better view of what to expect. In both November 2023 and July 2022 the breakouts were followed by sharp initial pullbacks in the market and gauges with initial profit taking. The drop to 0 on Aug 1st below was a glitch in the data that Monday and is more likely an average between the prior and subsequent trading days. The July breakout signal delivered +11.6% gains in the Russell 2000 over a period of 21 trading days with the S&P 500 +9.3%.
Value & Momentum Breakouts – Top Financial Models for Double-Digit Success
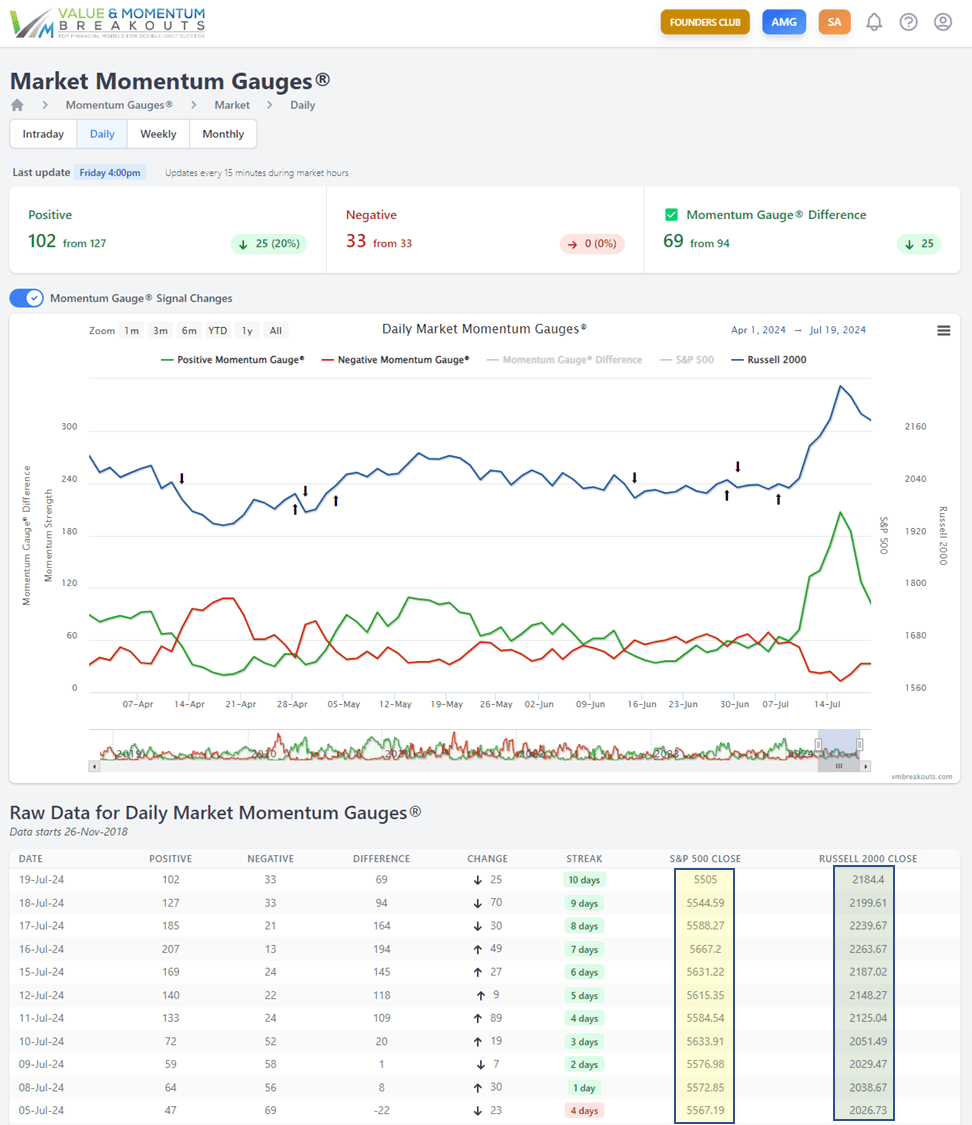
Our current July 2024 daily breakout signal
The current breakout signal is quite unique. While the Russell 2000 rapidly gained +11.0% from the July 8th signal, the S&P 500 has declined -67.9 points (-1.2%) after a small gain of +1.69%. You can see the differences between the S&P 500 and Russell 2000 highlighted in the raw data on the chart below. This suggests that the current rally is being driven by different forces than the prior rallies and likely the record skew in the Magnificent 7 that I wrote about in my recent article.
Value & Momentum Breakouts – Top Financial Models for Double-Digit Success
So what does this mean and what should we look for?
I will try to explain as I did back in November 2023 what could happen next and why. Using the TNA chart below lets examine the Bullish Stair steps that led to very large gains in the small cap bull fund.
Direxion Daily Small Cap Bull 3X Shares (TNA)
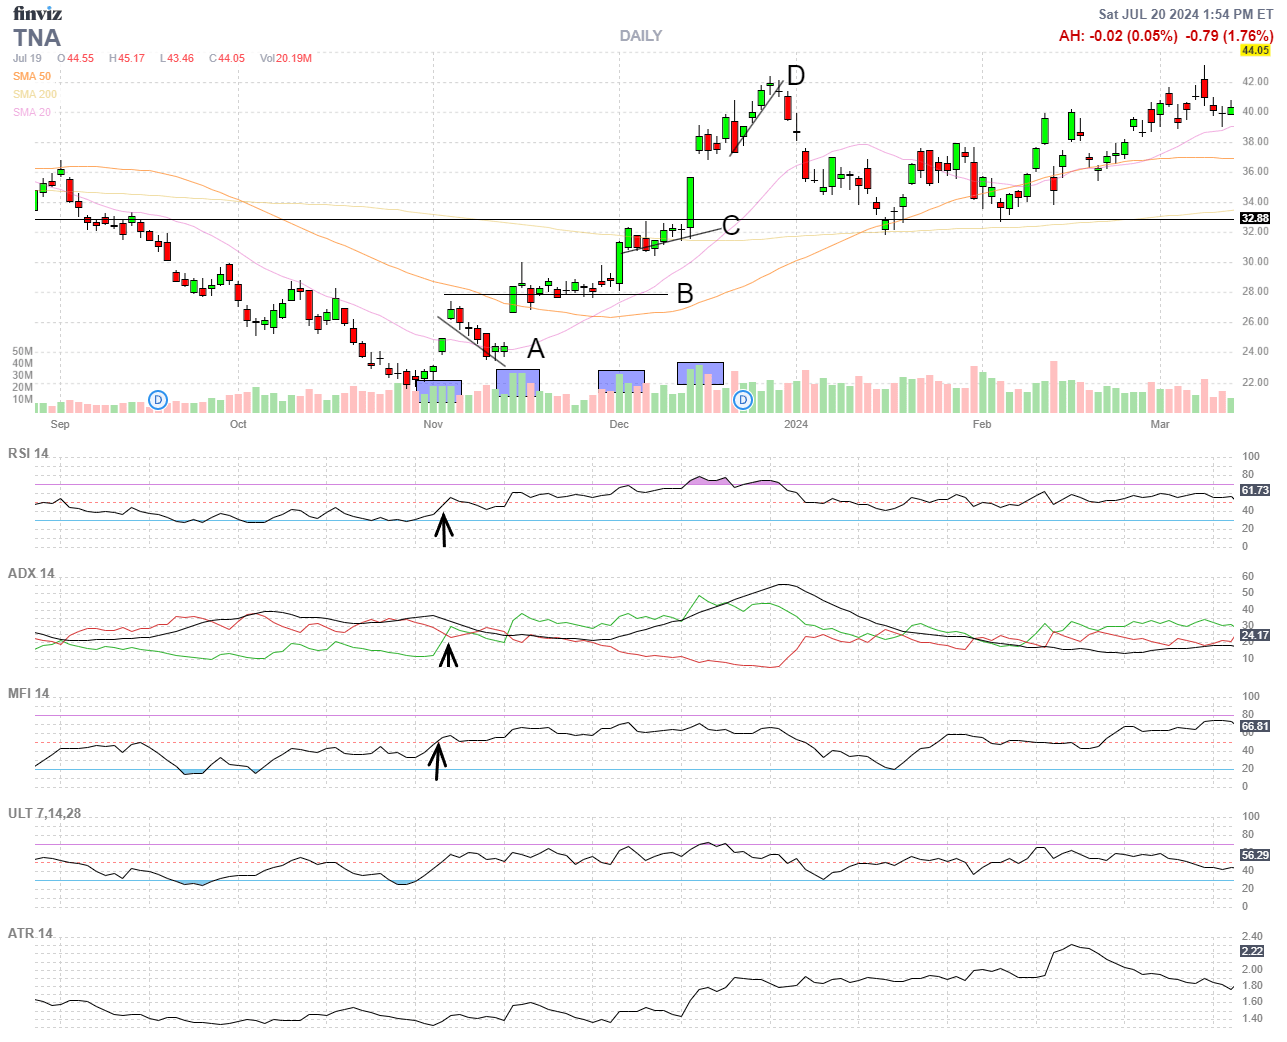
We can see four stages that I labeled A, B, C, D. We can see that the positive volume and the proxy technical indicators I use were all strongly positive. The volumes shown were extremely high and dwarfed prior volumes for more than a year.
- The first move A: Investors did not trust the breakout and immediately took profits to nearly a 50% retracement of the initial gains.
- Move B: Was a big dip-buying event that sent prices higher and investors held on to the gains in a flat consolidation for more than 2 weeks.
- Move C: Was another dip-buying event as investors got more confident, but this time kept adding to their positions with more confidence in the next consolidation.
- Move D: Was the largest move with late comers joining in the exuberance with almost no consolidation period as investors kept adding aggressively to the peak.
The final selloff from high overbought levels was likely driven by the earlier A, B, C, buyers who were ready to bank big profits and subsequently caused some panic among the late comers in D causing them to sell aggressively to minimize losses.
In this current breakout from the July 8th Momentum Gauge signal we can see clearly on the intraday TNA chart the strong the bullish stair steps. Then investors have followed with profit taking to nearly 50% of the original gains in the first breakout move of this large event. On Friday we saw consolidation at 44/share support through the day that could be another setup for dip-buying in the coming week.
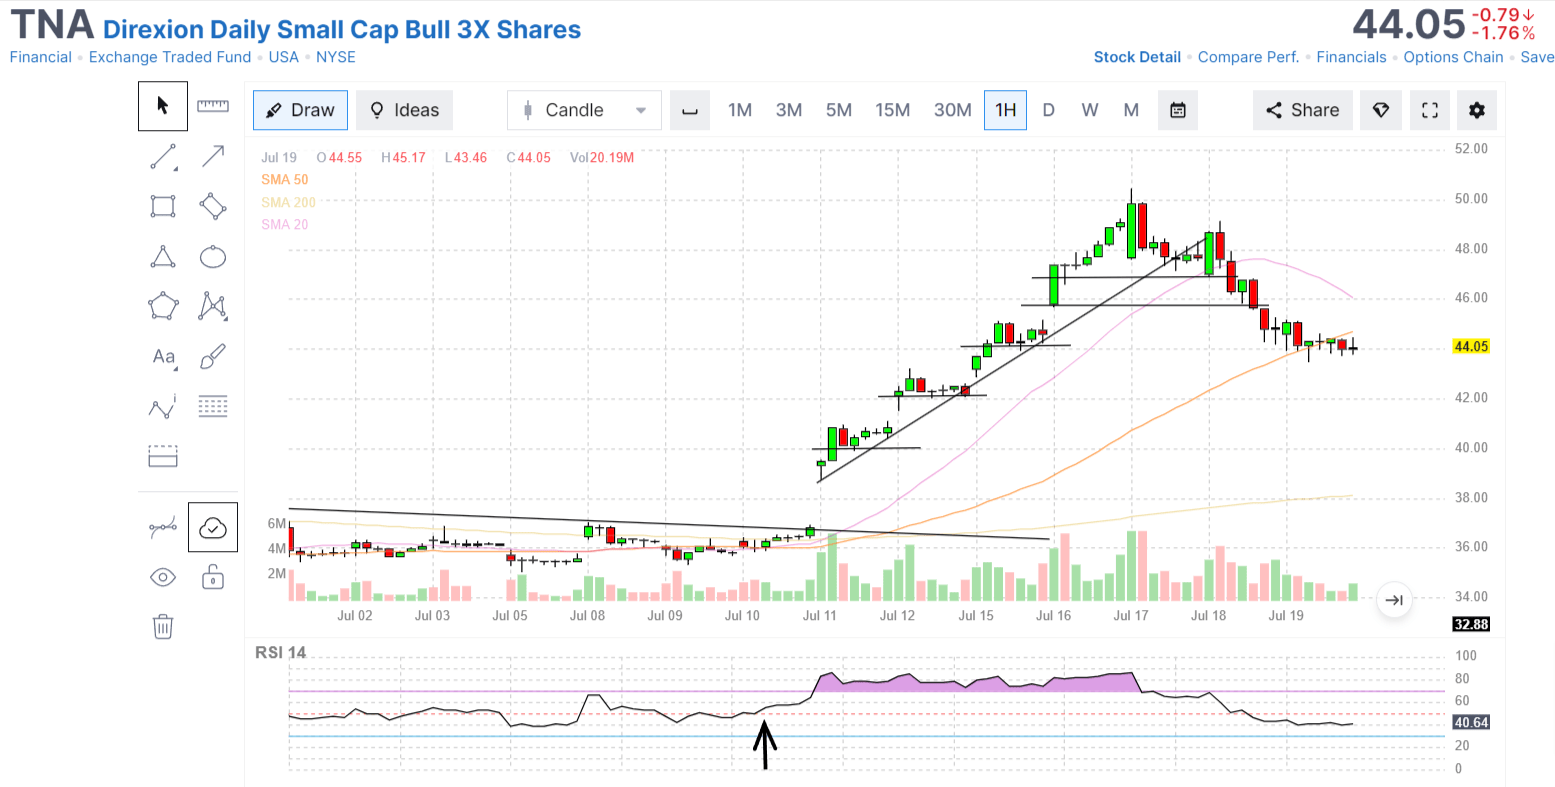
This initial move with the highest volumes since November and the highest positive MG gains in a 4 day period since July 2022, could, and I stress could be just part A of another series of bullish stair steps taking shape as it did back in 2023. Take a close look again at the charts above and watch to see whether dip-buyers return very aggressively in the coming days as CPI inflation has declined for the first time since May 2020.
Conclusion
So far we have only one large move to compare to the weeks of the last two strongest MG breakout signals that were both led by the small caps. No two periods of time are exactly identical. We have many forces at work as investors eagerly await the possibility of the first Fed rate CUT after 11 rate hikes in the fastest and steepest hiking series since 1977. I strongly recommend you read even a couple of my outlook articles to put these new signals in the best context for your trading decisions:
- Record Market Skew Leads To Broadest Stock Breakout Since November
- How 2024 Keeps Reminding Me Of 2021 Markets
I wish you the best in all your trading decisions! If you like this analysis please share it with your friends.
All the best,
JD