Summary
- Investors often misjudge growth and value stocks; familiarity leads to overvaluation of growth stocks and undervaluation of value stocks.
- I leverage scholarly research and timing models to identify long-term gains and short-term breakout portfolios across a wide variety of stocks.
- Ardmore Shipping and StealthGas Inc. are prime value selections, benefiting from strong fundamentals, positive momentum, and favorable energy sector conditions.
- Market signals and sector rotations are crucial; timing and diversified strategies are essential for maximizing returns in dynamic market environments.
- The prior 2-year Piotroski portfolio return from January 2023 returned +139.7% while January 2024 portfolio is improving with one more year of measurement to go.

Introduction
Investors are systematically too optimistic in their expectations for the performance of growth companies and too pessimistic in their expectations for value companies. One behavioral explanation is that investors confuse familiarity with safety. Because they tend to be more familiar with popular growth stocks, those stocks tend to be overvalued.” ~ Berkin, A., & Swedroe, L. (2016)
While we have only had six full trading days to start the new year, we are already seeing a shift to value from the record runs in momentum stocks. This article will highlight one of the top value portfolios combining measures from two different scholarly research studies that has consistently delivered positive returns in my public testing since 2017.
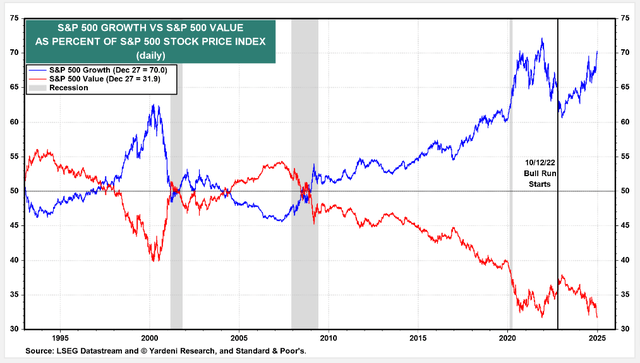
S&P 500 Growth vs. Value – 1994 to 2024
Chart 1. Growth stocks of the S&P 500 greatly increasing relative to the value stocks of the S&P 500.
I have spent the last 35 years trading, researching, and constructing algorithms to identify and leverage the value across fundamental, technical, and behavioral finance models. Of the ten portfolio models designed for optimal portfolio mixes for members to beat the market at Value & Momentum Breakouts, eight come from enhancing well-tested anomaly research in published financial journals.
If you believe like I do, that there is much more to stock trading than just buy, hold, and hope that every future event works out perfectly as promised for your stock – then these trading models are for you. This article highlights some of our recent top trades from three very different portfolio models, ranging from aggressive short-term weekly breakouts to long-term growth and value portfolios with high dividends.
Two trades from one of the most popular value models
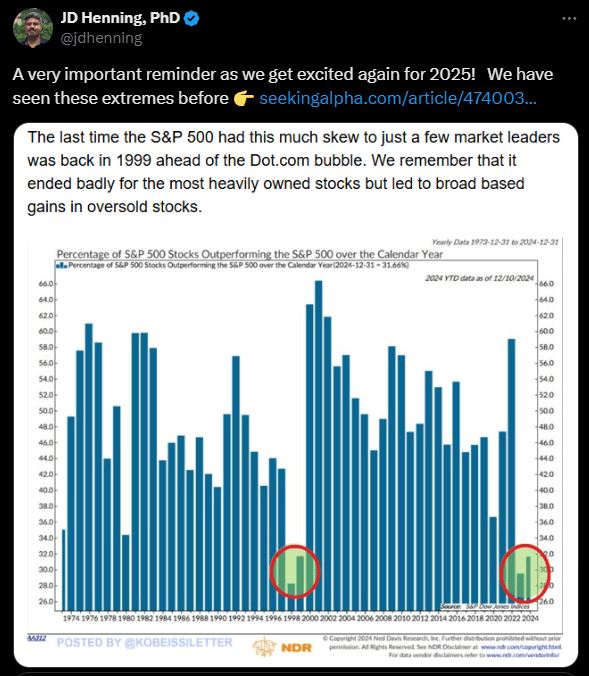
In this article, I provide another sampling of how we use the optimal portfolio models to identify long term continued strength, short term aggressive breakout stocks, and even apply timing models to long-term value stocks for the best results. As I repeatedly tell our investment community, it is important to not only diversify your stock selections, but it is also critical to be where the market fund flows are improving for the best returns. As many long-term traders know well and the chart below illustrates, it is very rare for one type of investment to lead in consecutive years. More details explain our process in my 2025 Market Forecast article. I am certain again this year that we will see more rotation and if you are just riding the buy and hold approach, you can find yourself in a painful situation.
Chart 2. Shows the fewest number of S&P 500 stocks outperforming the S&P 500 index since 1998/99.
This article builds on prior Total Return Breakout articles and especially the positive momentum gauge signal for the Energy sector from December:
Let me briefly introduce a couple stocks from our current long term portfolios, along with the energy market signal. These stocks each come from the Piotroski-Graham value model from among 10 different portfolio models shared at regular weekly, monthly, annual intervals depending on the portfolio type. Then I will explain the value selection process and the unique overlap with current momentum breakout conditions. Last, I will share why the timing matters even in our value investing portfolios for long-term growth.
Current Technical Breakdown
The last 2 years we have seen the Magnificent 7 or the 10 largest mega cap stocks completely outperform the broader market. As Charts 1 & 2 at the start of this article show we have not seen a skew to the fewest number of top performing stocks since 1998. These growth giants are well represented in the BMO REX MicroSectors FANG+ Index 3X Leveraged ETN (FNGU) shown below:
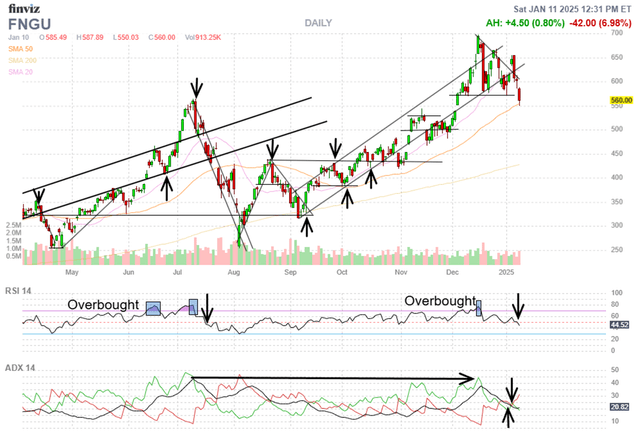
FNGU represents 10 of the largest stocks in the markets including Apple Inc (AAPL) that has entered the same breakdown conditions from short term overbought levels like last July. Also like last July, mortgage rates and bond yields are at the highest levels on rising fears of sticky inflation and higher energy costs, but that is a subject of another article.

Apple and the Magnificent 7 stocks are among the best growth stocks in the market since 2022 and some profit taking is entirely normal after record gains. The technical indicator breakdown of the positive channels both in July and most recently in December correspond closely to the negative Momentum Gauge signals. Support is strongest for Apple at 230/share that is not only the prior July peak, but at a level with numerous prior peaks over the past 6 months.
The most important thing to watch for in the coming weeks is a rotation to value stocks that have been largely ignored over the past few years. We are already seeing this rotation in our new January Piotroski-Graham value portfolio that outperforming the S&P 500 (SPY) (SPX) by +6.64% in the first two weeks of January. Half of the 10 stock portfolio is up over +10.3% through Week 2 of 2025. So let’s look at two of the value selections from a prior long term portfolio released last year that are also showing strong breakout conditions.
Two Value selections in the positive signal
First, we have Ardmore Shipping (ASC)
Ardmore Shipping comes from our Piotroski-Graham Value portfolio intended for two-year measurement returns following the scholars’ same two-year test period. This is an exclusively fundamental finance selection based on many key value ratios considered in two different scholarly models separated by decades in their published research. The proven Buy and Hold returns across the full 2-year timeline are well documented, but we know well that timing matters greatly, and signals can improve all your trading.
In the long term value portfolio we leverage published financial algorithms from scholars like Benjamin Graham and Joseph Piotroski, who have shown strong returns in the published literature. I have combined their two algorithms and enhanced them further to release these Piotroski-Graham value portfolios two times a year, in July and January. A new set of value stocks has been released for January as we continue to test this long term model every year on Seeking Alpha from 2018.
What is unique about Ardmore Shipping is that it has not had a positive MDA breakout signal since May of last year. Our MDA methodology explained in a webinar here on Seeking Alpha has expanded further to sector and market signals of momentum and money flows. Combining the excellent fundamental value scores with a timing indicator may give us a strong entry point for long term gains.
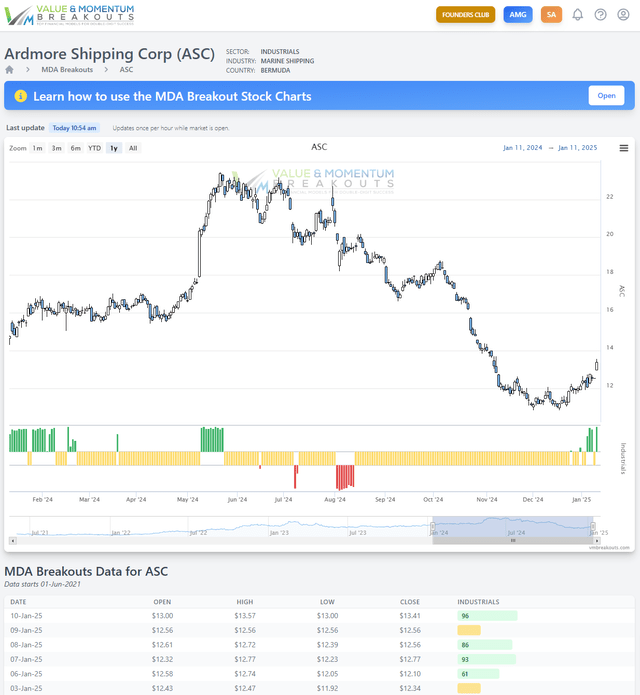
The excellent valuations and strong buying momentum support a move up to resistance around 16/share in the coming weeks. Ardmore also offers a large 8% dividend with analyst consensus price target around 17.60/share over no specified timeframe.
Second, we have StealthGas Inc (GASS)
StealthGas also comes from a prior long term Piotroski-Graham Value portfolio intended for two-year measurement returns. Not only do the valuations continue to be excellent with three consecutive quarterly earnings beats, but we are seeing a new Segment 6 positive acceleration breakout signal from December.
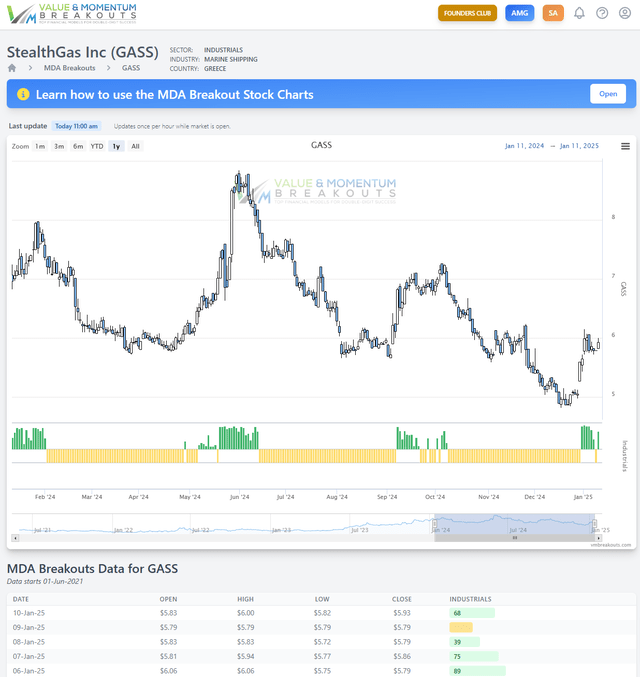
It is highly likely that this international energy transportation company stock is benefiting from the rising cost of petroleum products. Across the board we are seeing many of these undervalued stocks setting up for breakout conditions as I wrote in my previous article highlighting the Energy sector gauge breakout conditions. Analysts have a consensus target of 10/share for StealthGas and we can see that institutions are large net buyers in the most recent quarter.
Energy Momentum Gauges
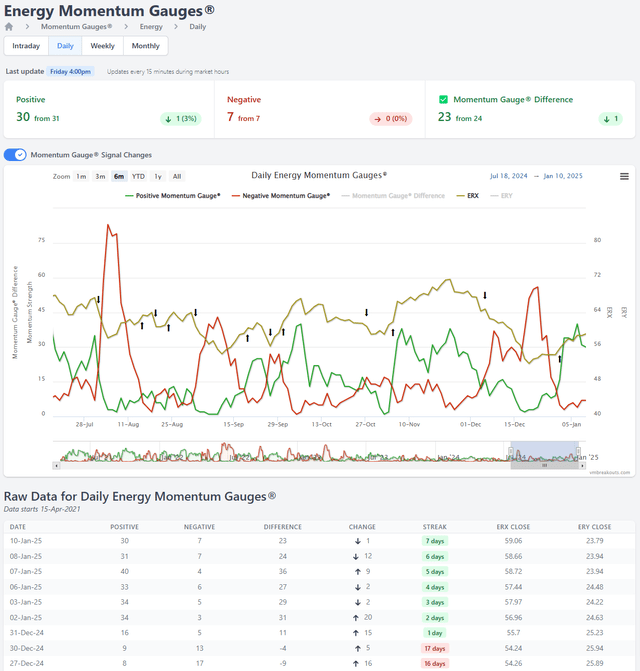
The sector gauges for energy gave us our first positive signal after 3 weeks negative with large downturns in the energy sector for December. Currently the daily energy gauges are the only positive daily sector gauges to start the third week of trading for the new year. The equity based MDA chart below shows the positive and negative momentum conditions (green and red) as applied to a popular energy fund (ERX) Direxion Daily Energy Bull 2X Shares (yellow). We are using ERX in our active fund, but fund performance from different ETF companies varies from signal to signal. Many energy funds may be considered until the next negative sector signal using your own preferred ETF company or different level of 1x to 3x leveraged funds to suit your own risk tolerance.
Value & Momentum Breakouts – Top Financial Models for Double-Digit Success
FINRA cautions investors that:
Exchange-traded funds (ETFs) that offer leverage or that are designed to perform inversely to the index or benchmark they track-or both-are growing in number and popularity. While such products may be useful in some sophisticated trading strategies, they are highly complex financial instruments that are typically designed to achieve their stated objectives on a daily basis. Due to the effects of compounding, their performance over longer periods of time can differ significantly from their stated daily objective. Therefore, inverse and leveraged ETFs that are reset daily typically are unsuitable for retail investors who plan to hold them for longer than one trading session, particularly in volatile markets.
Market Outlook
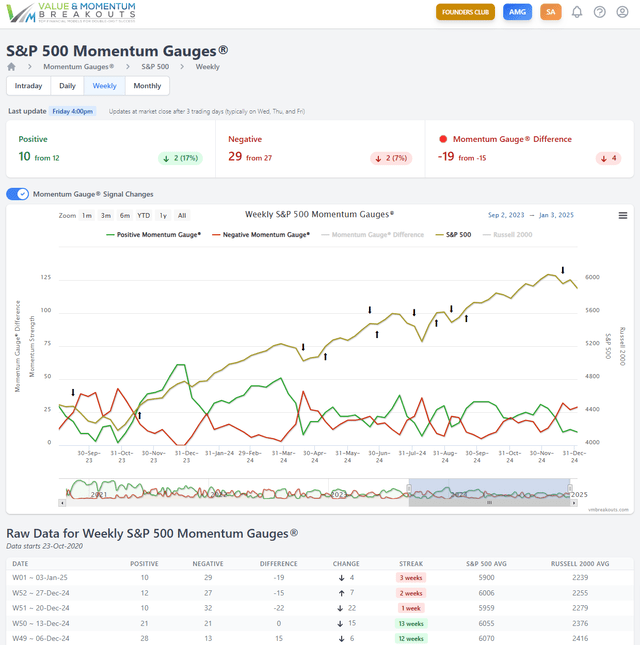
While our portfolios go out in fixed weekly, monthly and semi-annual schedules in our investment group regardless of market conditions, we can still benefit from market signals. Experience has shown that fighting against the MDA market variables can be very adverse to our returns. The market really doesn’t care how good we think of our selected stocks or market valuations, and it is wise to trade accordingly
Value & Momentum Breakouts – Top Financial Models for Double-Digit Success
The weekly S&P 500 gauges are still negative through a third weekly negative signal. We are watching to see if more sector can turn positive next week.
Conclusion
What I offer readers is intended to share different models for your future success. Scholars have documented for years that, “harvesting different risk baskets, each with a premium that has low-to-negative correlations to the others” is an excellent way to produce strong risk-adjusted returns. These ongoing sector rotations and signal changes continue to give us many new opportunities for profit in the years ahead as we build our optimal portfolio mixes each year.
Finally, it appears that the Santa rally this year may be a more muted event than prior years. Q4 rallies have had a remarkable pattern on the Bond charts like Direxion Daily 20+ Year Treasury Bull 3X Shares (TMF) Bond bull fund. We have seen strong bottoming patterns in Oct/Nov for TMF that led to end of December tops of profit taking. However, this year the bonds are still breaking down much earlier and longer as treasury yields rise to the highest levels in over a year.
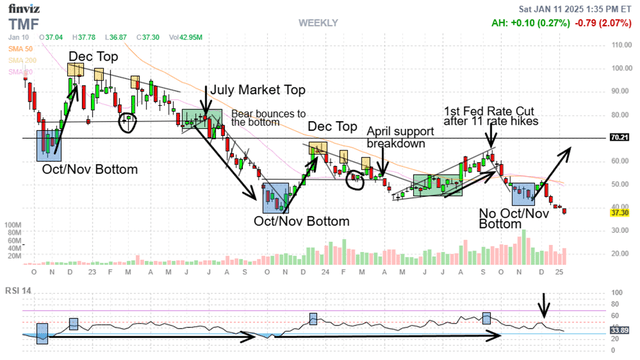
The bond chart is validated again by the U.S. Dollar index that has broken from prior multi-year patterns. We had seen a series of multi-year topping patterns in Oct/Nov for the dollar that helped fuel market rallies. However, the correlated pattern appears to have broken down for the first time in several years as the U.S. Dollar continues to the highest levels since November 2022.
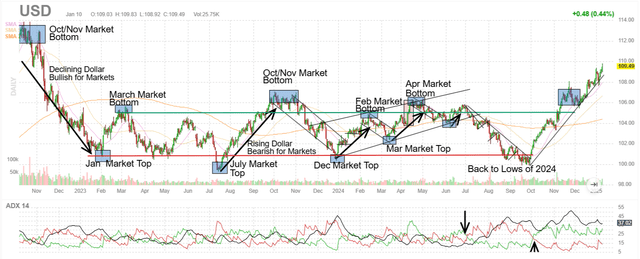
These additional macro signals give me some reasons to be more cautious for now. While I don’t profess to know exactly why or even the top reasons that investors choose to buy one security over another, I do know that timing matters greatly. This article shares a few ways to detect strong opportunities early, and leverage unique statistical models published in financial literature for our benefit. You may be able to leverage our selections and signals even better than I do.
I wish you well in all your trading decisions, and I hope you have a Happy and Prosperous New Year!
JD Henning, PhD
References
Berkin, A., & Swedroe, L. (2016). Your complete guide to factor-based investing: The way smart money invests Today. Buckingham.


