Summary
- Highlighting top stock picks for 2025, including SoundHound AI, Banco Macro, and Tesla, using diverse portfolio models for optimal returns.
- Emphasizing the importance of timing and market conditions in trading, beyond the traditional buy-and-hold strategy as all new portfolios are released for 2025.
- Noting macro market signals indicating potential caution, with unusual patterns in VIX, US Dollar, and bond markets.
- Encouraging readers to leverage unique statistical models and sector rotations for profitable opportunities in changing market conditions.

Introduction
Weird things can happen without bubbles, but bubbles cannot happen without weird things.” ~ Owen Lamont, Acadian Asset Management
Some unusual market conditions are forming and I will address them at the end of the article in the Market Outlook section after highlighting some strong picks for 2025 as new portfolios get released in my 9th year on Seeking Alpha.
I have spent the last 35 years trading, researching, and constructing algorithms to identify and leverage the value across fundamental, technical, and behavioral finance models. Of the ten portfolio models designed for optimal portfolio mixes for members to beat the market at Value & Momentum Breakouts, eight come from enhancing well-tested anomaly research in published financial journals.
If you believe like I do that there is much more to stock trading than just buy, hold, and hope that every future event works out perfectly as promised for your stock — then these trading models are for you. This article highlights some of our recent top trades from three very different portfolio models, ranging from aggressive short-term weekly breakouts to long-term growth and value portfolios with high dividends.
Three Trades from Different Portfolio Models
In this article, I provide a sampling of how we use the optimal portfolio models to identify long term continued strength, short term aggressive breakout stocks, and even apply timing models to long-term value stocks for the best results. As I repeatedly tell our investment community, it is important to not only diversify your stock selections, but it is also critical to be where the market fund flows are improving for the best returns. As many long term traders know well, it is very rare for one type of investment to lead in consecutive years. As I detail in my 2025 Market Forecast article, I am certain again this year that we will see more rotation and if you are just riding the buy and hold approach you can find yourself in a painful situation.
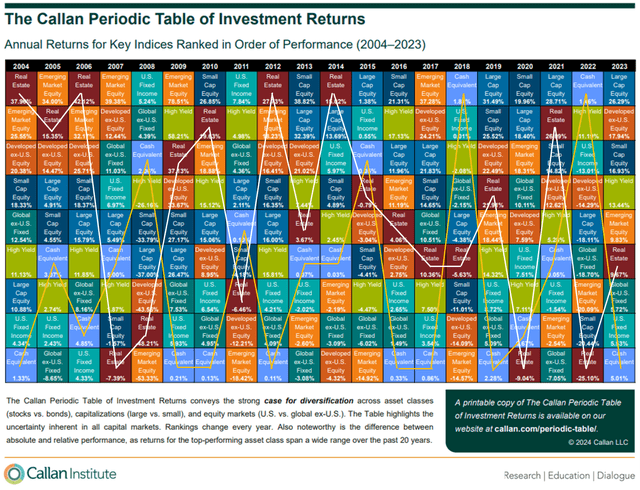
First, let me briefly introduce a sample of stocks that I will review in this article along with a few new picks. These stocks each come from different models that I share for members at regular weekly, monthly, annual intervals depending on the portfolio type. Then I will explain why each stock was selected for its respective portfolio. Last, I will share why the timing matters even in our value investing portfolios for long-term growth.
- SoundHound AI, Inc.
- Banco Macro S.A. ADR
- Tesla, Inc.
Three Different Portfolios
SoundHound (SOUN) comes from our negative Forensic anomaly portfolio that selects the most unusually negative scoring stocks using four of the top forensic algorithms in the financial literature. Negative scores do not necessarily confirm anything bad about the stock, but highlight fundamental ratios that are well outside normal accounting ranges. Such negative extremes in the algorithms can actually reveal a positive result from unusual changes. I will not go into much detail on the algorithms here, but if that field of financial analysis interests you, then consider my forensic analysis on Infosys (INFY) or on Super Micro Computer (SMCI) regarding the recent resignation of the E&Y accounting firm:
- Super Micro Computer And Forensic Flags To Consider After E&Y Resignation
- US Fraud examiner says forensic algorithms show no evidence of financial wrongdoing at Infosys
Both the Positive and Negative Forensic portfolios are released two times each year here on Seeking Alpha since 2018. New portfolios begin this week to start the year and new portfolios go out in July for new mid-year selections. SoundHound was one of the stocks selected in the mid-year portfolio and also had one of largest followings on WallStreetBets.
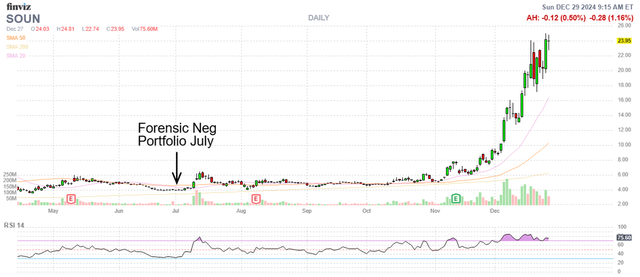
I frequently post about anomalies, especially in stocks that develop “Meme” tendencies and large social media followings. Checks of forensic conditions in prior meme stocks like Gamestop (GME) and AMC Entertainment Holdings (AMC) can help us manage tremendous risk. SoundHound was of particular interest as it had emerged in the fundamental algorithms qualifying for this forensic portfolio.
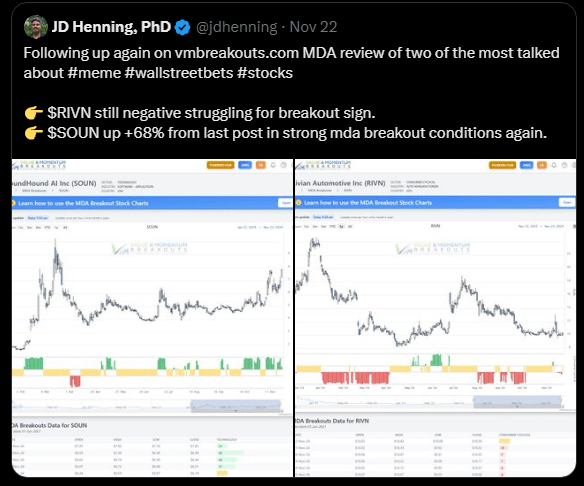
In addition to the forensic models, I apply measures from my MDA published research and top variable charts using statistical analysis across behavioral, fundamental, and technical characteristics. To confirm breakout signals for trading, we rely heavily on the combination of these different key variables.
The chart below shows how SoundHound was also later selected in November as a weekly breakout portfolio stock with strong momentum. The charts now simplify my statistical calculations into a colored range from buy to sell signals using green/yellow/red bars. Each bar reflects the strength of the computed values to forecast price change without using the “daily price change” as a predictor variable for what we are trying to predict.
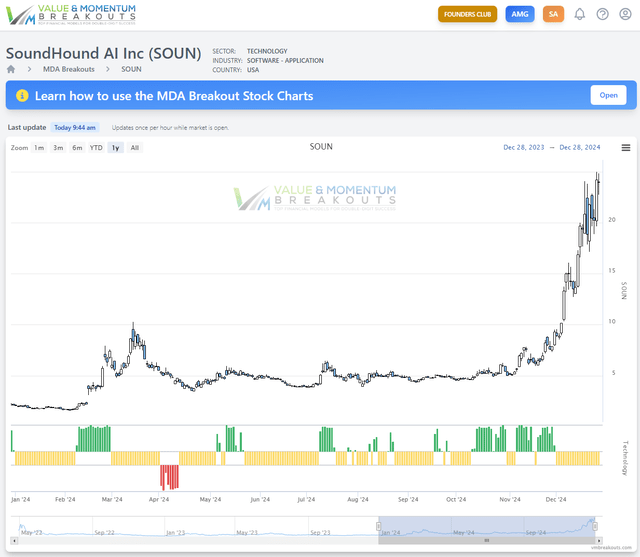
As you can see on the multiple-discriminant analysis [MDA] chart, SoundHound stock triggered an additional buy signal on July 10th at 4.24/share. With no strong negative signals since and still in the long term forensic portfolio into 2025 it is now up +506.3% from selection. Six of the 10 stocks in this negative forensic portfolio are up over 40% from July led by SoundHound with ten more additional selections out today to start the New Year!
Next, we have Banco Macro S.A. (BMA) that comes from our Piotroski-Graham Value portfolio intended for two-year measurement returns following the scholars’ same two-year test period. While measurements are made based on Buy and Hold approach across the full timeline, we know well that timing matters greatly and signals can improve all your trading.
In the long term value portfolio we leverage published financial algorithms from scholars like Benjamin Graham and Joseph Piotroski, who have well documented results in the literature at beating the markets. I have combined their two algorithms and enhanced them further to release these Piotroski-Graham value portfolios two times a year, in July and January. A new set of value stocks has been released for January as we continue to test this long term model every year on Seeking Alpha from 2018.
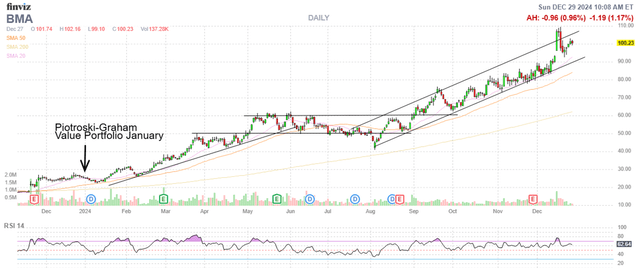
Banco Macro was selected last January for long term gains based on strictly on fundamental value metrics. While not even the top performer in this two-year 10-stock portfolio, it has delivered +510.4% returns in the first year of tracking. Valuations remain strong for 2025 on each of the two models developed by Benjamin Graham and Joseph Piotroski as well as the added enhancements from my research. In addition to strong price performance the stock delivered a high 5.29% dividend yield last year that is not included in the listed return performance for our Value & Momentum investment group members.
Lastly, we have a strong growth stock Tesla (TSLA) still riding high on the positive MDA breakout signal from Oct 24th at 244.68/share up +76.4% on the recent signal. As we know, Tesla is a pure mega cap growth stock offering no dividends and failing on many of the value measures created by Graham and Piotroski. I will detail more about this record skew between Growth and Value in the next section. For now consider that Tesla is up to a P/E ratio of 118.25x earnings, while the average of the 10 largest market cap growth stocks is at 57.5x earnings. Then consider that overall S&P 500 P/E ratio is only at 21.6x and includes all the most highly valued mega cap growth stocks like Tesla.
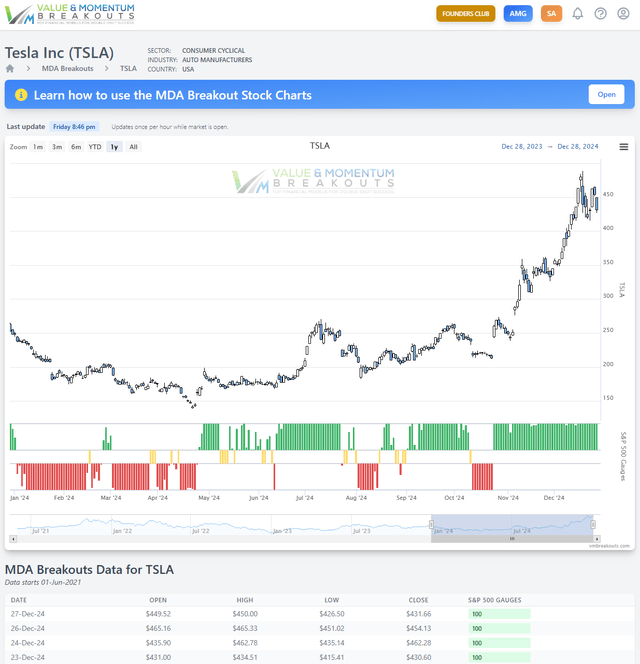
Factors for strong price growth often have little to do with fundamental valuations and metrics used in classical finance. The MDA chart for Tesla bears out the strong positive momentum from large inflows. Some of the outsized momentum conditions can come from index funds and the enormous popularity of trading ETFs for a basket of strong stocks with a single trade.
For example, the BMO REX MicroSectors FANG+ Index 3X Leveraged ETN (FNGU) of the 10 largest mega cap growth stocks in the market, including Tesla is shown below. The skew into the fewest number of stocks in the market is back to the highest levels since 1998 just before the dot.com bubble. We could be in for an exciting year of rotation.

Even the best models in the financial literature can underperform when market conditions are at extremes as they are now. Overall the Value stocks are greatly underperforming the Growth stocks as a % of the S&P 500 index and could come back into favor as investors eventually move out of the most crowded growth trades.
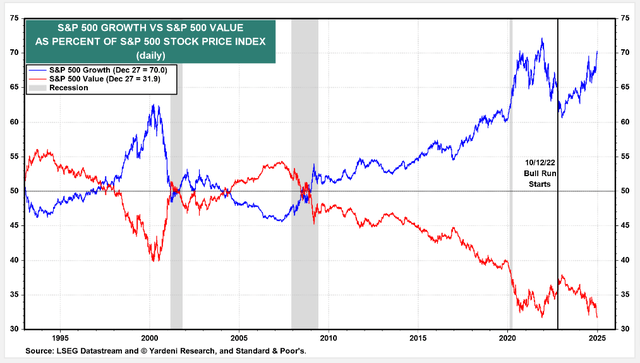
A major risk to growth stocks is that ETF fund managers, especially index fund managers, are required to keep buying many of the same growth stocks with no regard to valuations or fundamentals. This is where following momentum signals can significantly protect your gains when changes in investor behaviors begin to impact the amazing growth stocks in our markets.
Market Outlook
While the value portfolios and forensic portfolios go out twice a year regardless of market conditions, our other portfolios are very much based on market conditions. Experience has shown that fighting against the MDA market variables can be very adverse to our returns. The market really doesn’t care how good we think of our selected stocks or market valuations.
To account for the “weird things that can happen with or without bubbles,” the S&P 500 (SPY) (SPX) momentum gauges evaluate the MDA characteristics of all the stocks in the index to assemble a sort of advance/decline momentum ratio.
Currently, the Weekly S&P 500 Momentum Gauges are negative again in the longest negative signal since September and avoided another -66.7 point decline of the index on Friday. Prior to this there have only been 4 negative weekly signals in the past year avoiding approximately -173 points of decline and no signal has lasted longer than 3 weeks since 2023.
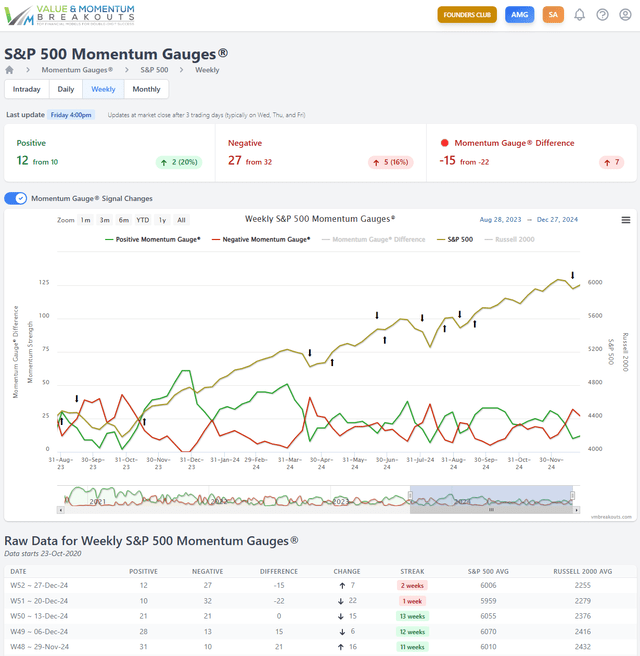
Measurements from 2018 have shown us that there has never been a major market decline on the major indices without both the S&P 500 and Technology gauges negative. Because the technology sector is so large and has such a heavy weighting on the “market” indices we have seen many instances where a majority of the traded stocks are declining while the S&P 500 or Nasdaq continues to gain. So far the heavy skew toward technology remains positive and for the Direxion Daily Technology Bull 3X Shares (TECL) as a proxy for technology shown in yellow on the chart.
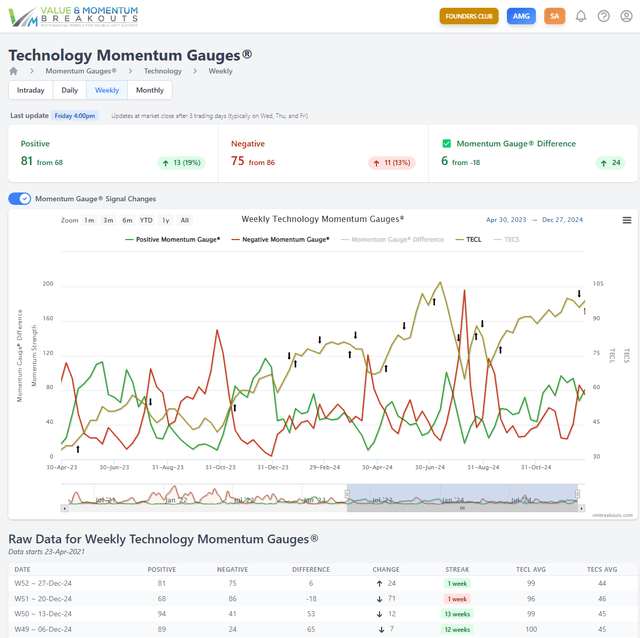
These checks tell us that while a majority of MDA sector gauges are negative the strong Technology breakout conditions are highly advantageous to selecting stocks in these sectors. Even value investing can benefit from adjusting appropriately to changing investor behavior, as money always circulates to the next best opportunity.
Conclusion
What I offer readers is intended to share a model for your future success, as well as to build on prior signal events with more insights on how to benefit from changes in the market momentum conditions. The ongoing sector rotations continue to give us many new opportunities for profit in the years ahead as we build our optimal portfolio mixes each year.
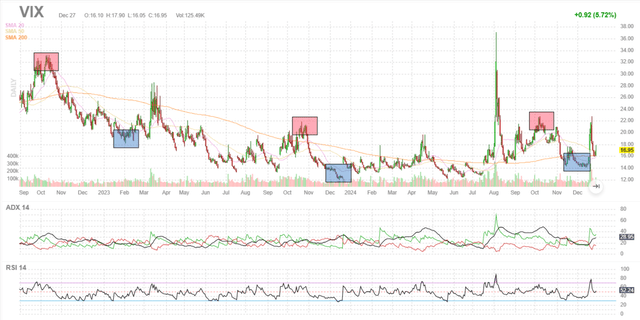
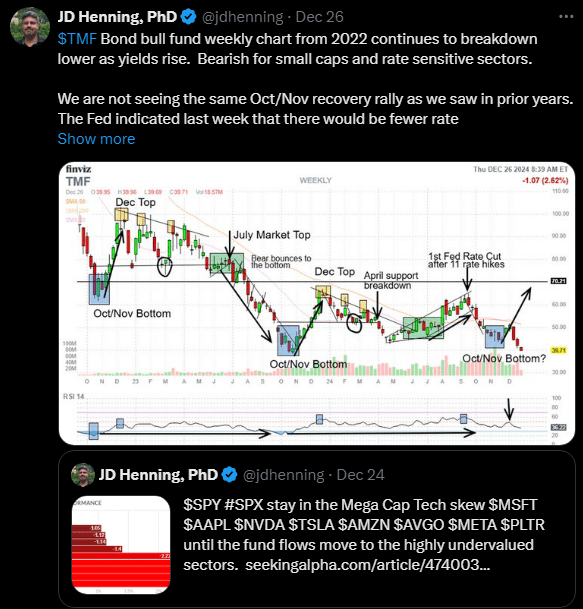
Lastly, and probably of most interest, macro market conditions are beginning to change from prior patterns across the VIX, US Dollar, and the bond market. Three more charts give us a bigger picture to illustrate my expectations:
The VIX volatility index shows a pattern of October tops leading to December bottoms when investors begin to sell again and volatility rises. However, since the market gauges turned negative in December, we are seeing this pattern being pulled forward much sooner in December with a large volatility spike back to October highs than in prior years.
Additionally, Q4 rallies have had a remarkable pattern on the Bond charts like Direxion Daily 20+ Year Treasury Bull 3X Shares (TMF) Bond bull fund. We have seen strong bottoming patterns in Oct/Nov for TMF that led to end of December tops of profit taking. However this year the bonds are breaking down much earlier as treasury yields rise to the highest levels in over a year.
Lastly, the US Dollar index has delivered a series of multi-year topping patterns in Oct/Nov that have led to large declines in the dollar value, while lifting markets to new highs for each new year. However, the correlated pattern has broken down for the first time in several years as the US Dollar continues to the highest levels since November 2022.
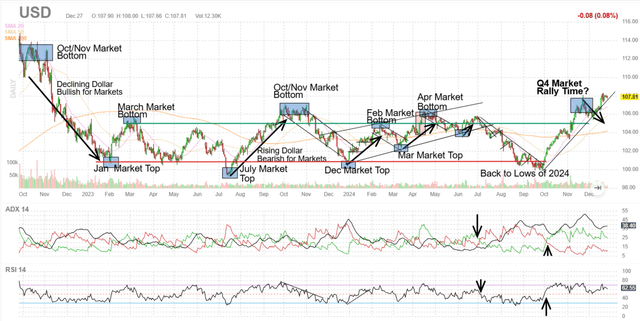
All of these macro signals give me some reasons to be more cautious for now. While I don’t profess to know exactly why or even the top reasons that investors choose to buy one security over another, I do know that timing matters greatly. This article shares a few ways to detect strong opportunities early, and leverage unique statistical models published in financial literature for our benefit. You may be able to leverage our selections and signals even better than I do.
I wish you well in all your trading decisions and I hope you have a Happy and Prosperous New Year!
JD Henning, PhD


