Summary
- The current market shows extreme skew, reminiscent of the 2000 dot-com bubble, with natural rotation toward value stocks.
- Timing is crucial; relying solely on buy-and-hold strategies can lead to significant losses during market rotations.
- Momentum Gauges and value portfolios, like Piotroski-Graham and Forensic anomaly portfolios, have shown strong performance and can help navigate market downturns.
- The S&P 500 had its first day of the year down -2% this past week, and this is significantly below annual averages.

Introduction
The enthusiasm for Tesla and other bubble-basket stocks is reminiscent of the March 2000 dot-com bubble. As was the case then, the bulls rejected conventional valuation methods for a handful of stocks that seemingly could only go up. While we don’t know exactly when the bubble will pop, it eventually will. – David Einhorn, 2017
I have spent the last 35 years trading, researching, and constructing algorithms to identify and leverage the value across fundamental, technical, and behavioral finance models. Of the ten portfolio models designed for optimal portfolio mixes for members to beat the market at Value & Momentum Breakouts, eight come from enhancing well-tested anomaly research in published financial journals.
If you believe like I do, that there is much more to stock trading than just buy, hold, and hope that every future event works out perfectly as promised for your stock – then these trading models are for you. This article highlights the importance of timing and reveals stocks from our top portfolios that may weather the record rotation currently underway.
As I detailed in my 2025 Market Forecast article and recent updates, I am certain again this year that we will see more rotation. And if you are just riding the buy and hold approach, you can find yourself in a painful situation.
Highlighting the Value of Momentum Gauges
This week, I share a unique insight into the portfolios that are likely to do well into the next stages of this record market rotation we have been cautioning about for more than a year:
- Total Return Breakouts: Highest Negative Momentum Since 2022 In Next Rotation Stage
- Market Resilience Amidst The Brutal Rotations To The Next Rally
- Record Market Skew Leads To Broadest Stock Breakout Since November
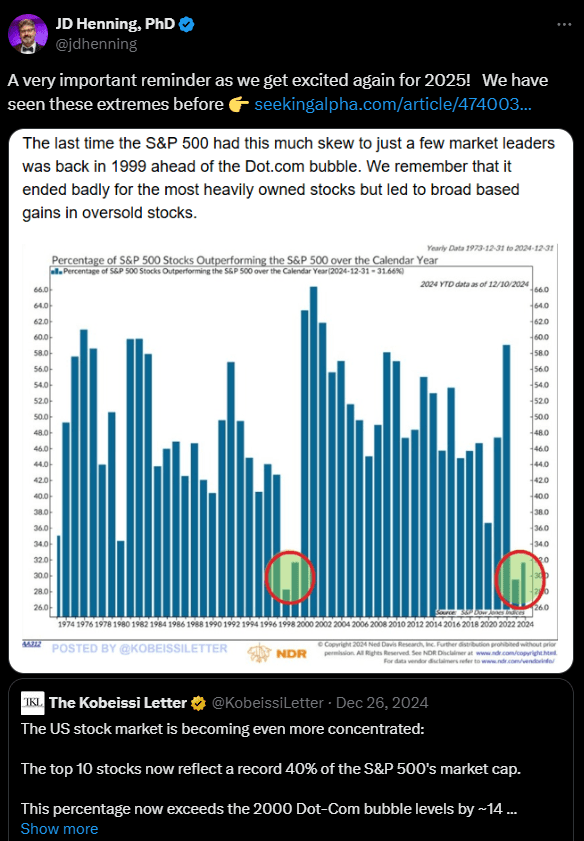
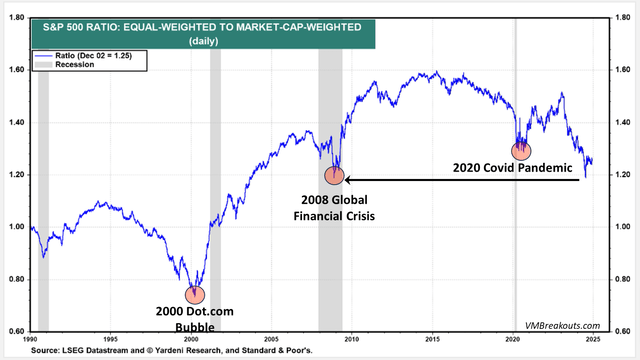
If you have been following my articles and posts above, then you know that I have been cautioning thousands of readers and subscribers about the record market skew for more than a year. Validating evidence can be shown in three key charts.
1. The fewest number of S&P 500 stocks outperforming the S&P 500 index over the past calendar year.
The last time the S&P 500 had this much skew to just a few market leaders was back in 1999 ahead of the Dot com bubble.

2. The worst skew between S&P 500 equal-weighted and market-cap weighted index since the 2008 global financial crisis.
Record stimulus and debt has fueled a major run in the markets that, in combination with programs like the CHIP Act and the Inflation Reduction Act, has concentrated significant benefits to a few of the largest stocks in the S&P 500. An unwinding from this concentration is a natural phenomenon we should expect to see over the next couple years.

3. The largest move to cash in the history of Berkshire Hathaway.
Warren Buffett started the year with over $280 billion in cash, the largest cash holding in his company’s history, even as the S&P 500 was hitting record highs to the middle of February.
Warren Buffett has been net selling BRK holdings for 9 consecutive quarters since the before the November 2023 rally. It still looks absurd as the S&P 500 hits new highs, but he is revered as a genius of the markets. – J.D. Henning, December 5th, 2024


