Summary
- The article presents five unique long-term portfolio models that have consistently outperformed the S&P 500 since 2018.
- The 2024 Piotroski-Graham value portfolio and Growth & Dividend portfolio have seen large inflows and positive returns in the first four days of the year.
- Stock portfolio models offer diversification and the ability to optimize individual risks/returns and timing is crucial as winning stocks and sectors change frequently.
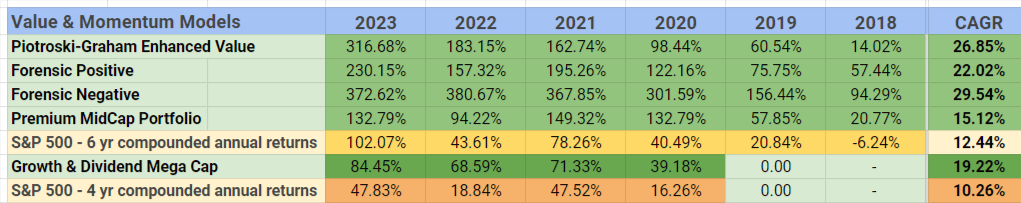
- For a 2nd consecutive year, the annual Piotroski-Graham value picks delivered the best returns of the long-term models in 2023 of +47.40% and +52.40% with dividend-adjusted returns.
- Research shows that returns could be further enhanced by following the Momentum Gauge signals to avoid major downturns.
- Looking for a portfolio of ideas like this one? Members of Value & Momentum Breakouts get exclusive access to our subscriber-only portfolios. Learn More »

Introduction
This article gives some new selections from five unique long-term portfolio models that have continued to outperform the S&P 500 since 2018. At the risk of revealing many years of research and enhancements, I will share some key insights about these financial models for your benefit. With one short trading week of performance behind us, I am sharing a few selections from our 2024 long-term portfolios in the sequel to my previous article: Part 1: 5 Stock Portfolios And Their Performance Vs. The S&P 500 Since 2018, And A Huge Gap
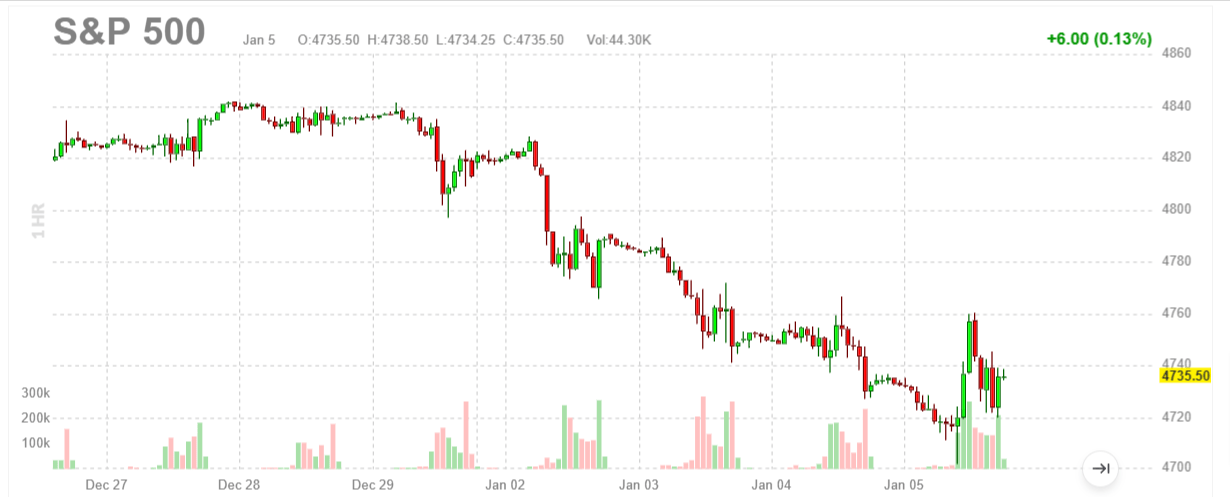
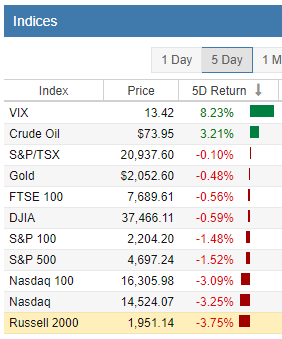
The major indices have started the year with very large declines as we begin to see asset rotations and changing investor strategies from 2023. Yet we already see very large inflows to value with the 2024 Piotroski-Graham value portfolio +5.29% and Growth & Dividend portfolio +2.02% in just the first four days of the year.
I hope this article provides you with three key insights to help your investing in 2024:
- Stock portfolio models offer additional advantages over individual stock picking that allow you to mitigate idiosyncratic risk through diversification.
- While stocks share some common systemic investment risks, there are many different types of stocks in the market to choose from to optimize your individual risks/returns.
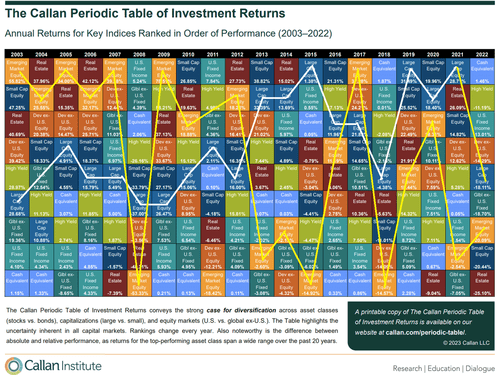
- Finally, timing matters greatly, and winning stocks and sectors change frequently. The leading asset class one year is rarely the top performer in consecutive years.
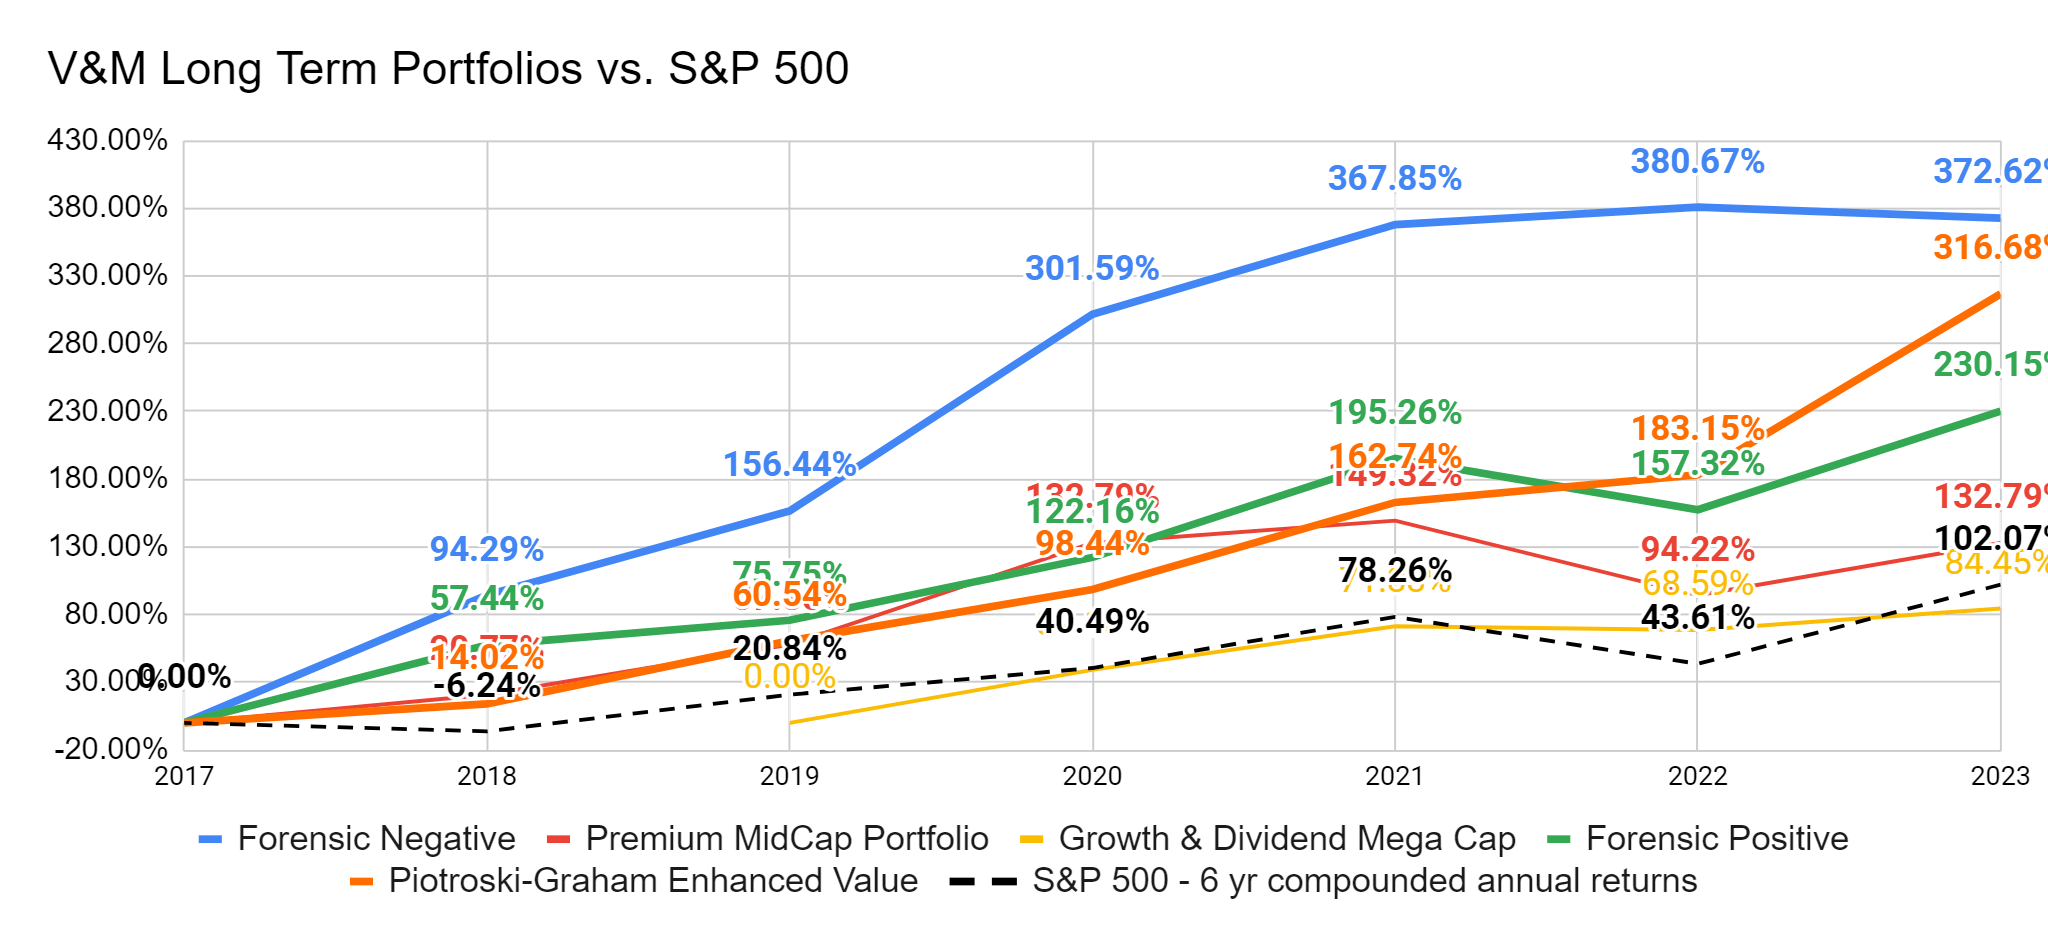
6 Years of Returns from Jan 2018 to Dec 2023
These five unique portfolios show different advantages with strong growth rates. I have found that five is a good mix for managing variation when it comes to timing indicators, funds to hold, or portfolio models to best leverage market returns. I trust you will see the advantages to each of these models and why I have selected them from among many hundreds of portfolios I have evaluated over the years.
As you consider these long-term buy/hold returns for your own investing, there are two additional key factors that can greatly enhance your returns even more. I will address these two very important timing factors at the end of the article:
1. Momentum Gauge signals – Why timing matters so much. Great stocks can do poorly when market outflows are increasing.
2. Macro/Systemic Market conditions – Why understanding the market environment (Fed rates, treasury yields, liquidity, corporate buybacks) is critical.
Without further details and discussions, here are my five diverse long-term portfolios with actual returns, free of common distortions from simulated back-testing or future extrapolations. As this article will illustrate, past returns are no guarantee of future returns and you should adjust accordingly.
1. Piotroski-Graham Enhanced Value portfolio
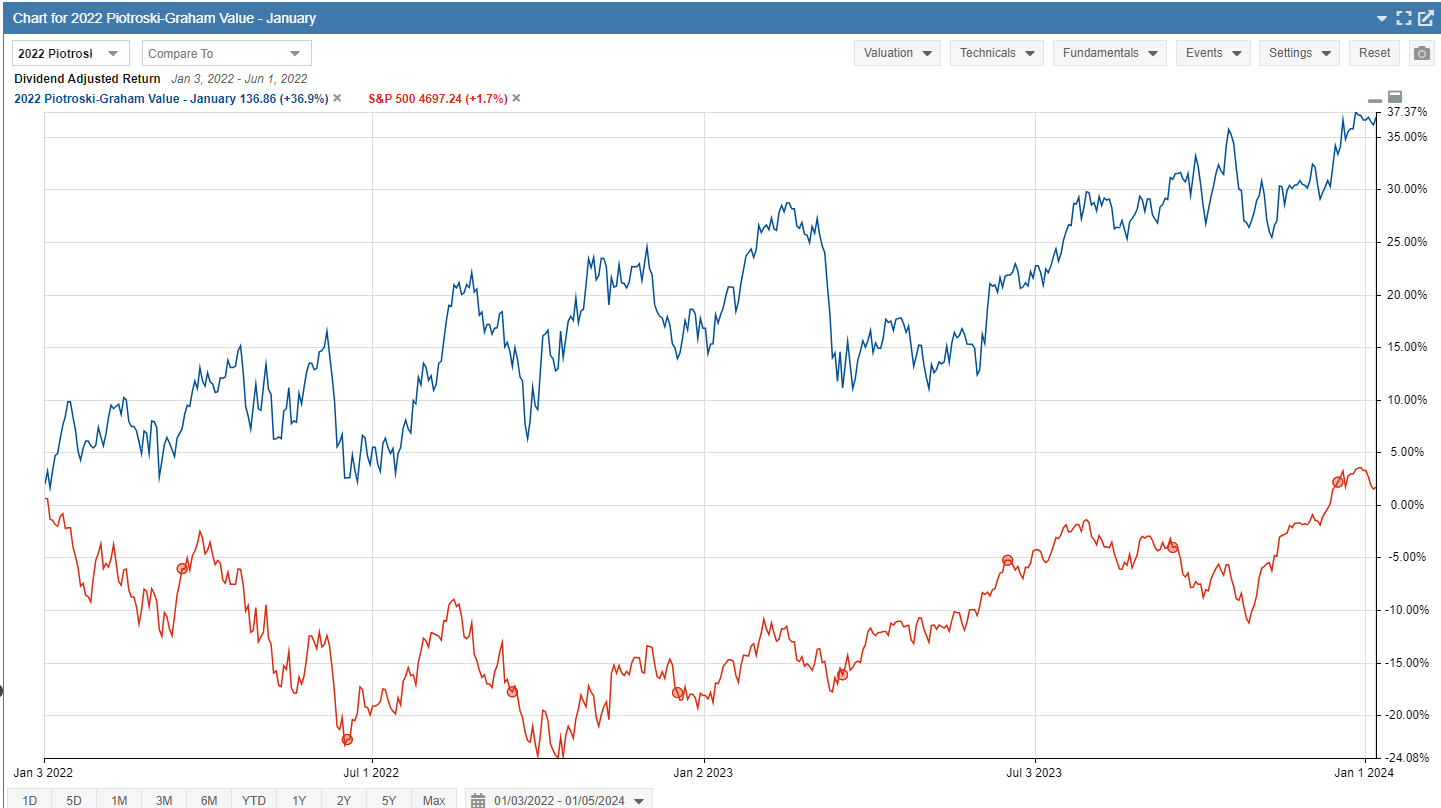
Let’s start with the algorithm portfolio using the value models from Joseph Piotroski and Benjamin Graham. Not only have these long-term value approaches survived decades of testing in the published financial literature, but the additional enhancements I have made show even larger returns than baseline portfolios these scholars originally published. These scholar’s models were measured to deliver strong gains over two years. Currently, the 2-year January 2022 buy/hold value portfolio is up +36.9% compared to the S&P 500 two-year gains of +1.7% with dividend-adjusted returns.
So far, this enhanced value portfolio has beaten the S&P 500 in every year since 2018 with sizeable annual and compounding returns well above the S&P 500. The 2023 returns from last year exceeded 47% and with dividend-adjusted returns reached +52.40% total returns not shown in my annual reports.
It’s quite common for these value portfolios to be paired against growth portfolios in a relatively strong inverse relationship. But what I have observed from years of study is that most long-term buy/hold portfolios (value or growth) benefit even more strongly from avoiding large market downturns following the Momentum Gauge signals.
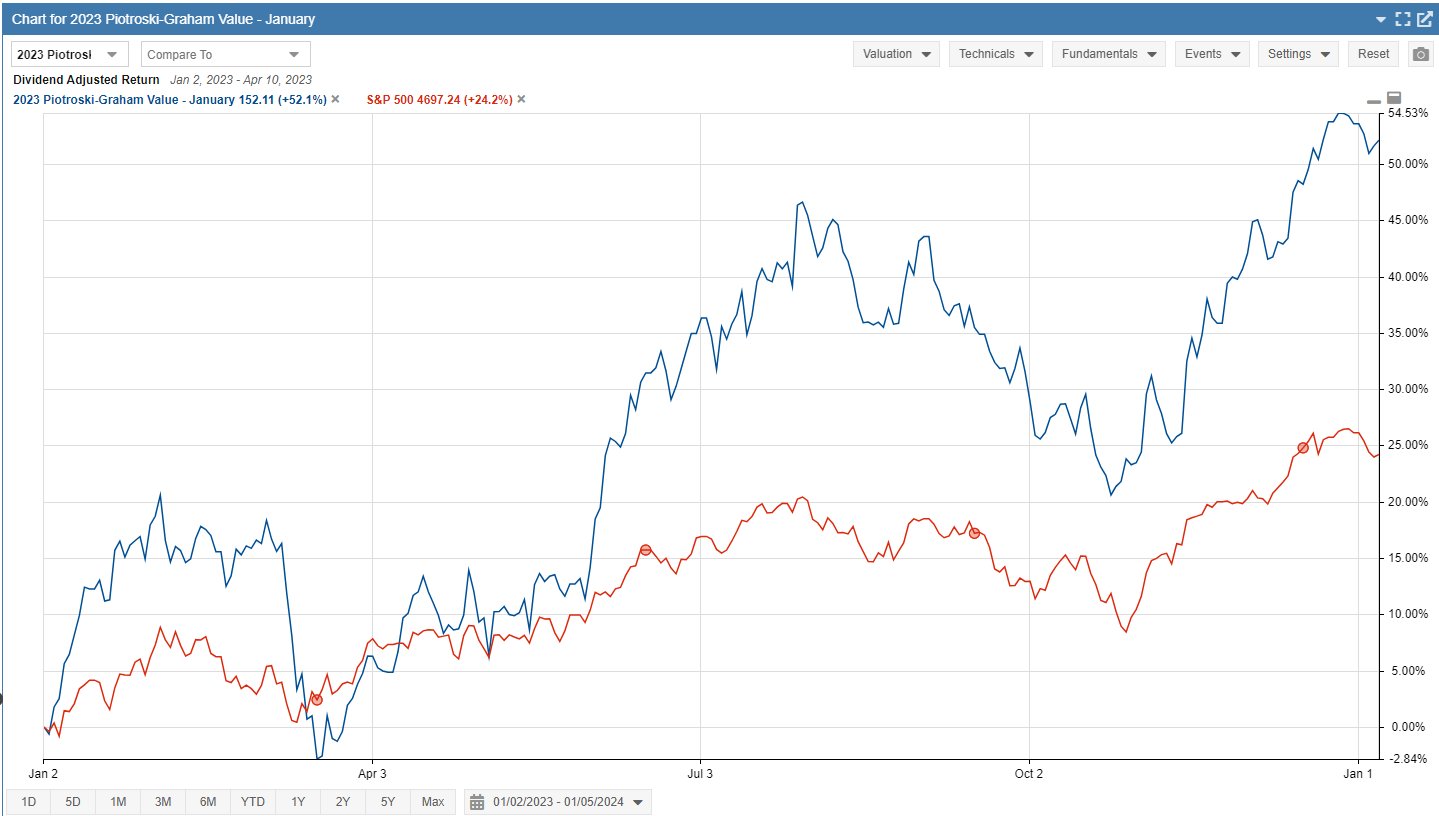
Let me explain further by using a momentum model I constructed from my doctoral research days. As you can see below, using the Momentum Gauge signals, the weekly negative signals in February preceded the major downturns in March from the banking crisis earlier this year. Then positive signals in April preceded the run to the August peak. Once again, negative signals in July/August preceded the longest market downturn of the year with 10 weeks of declines to the lows of October, before positive momentum began to rebound. You can see how following these signals further avoids downturns and increases total net returns above +52.1% from January of 2023.
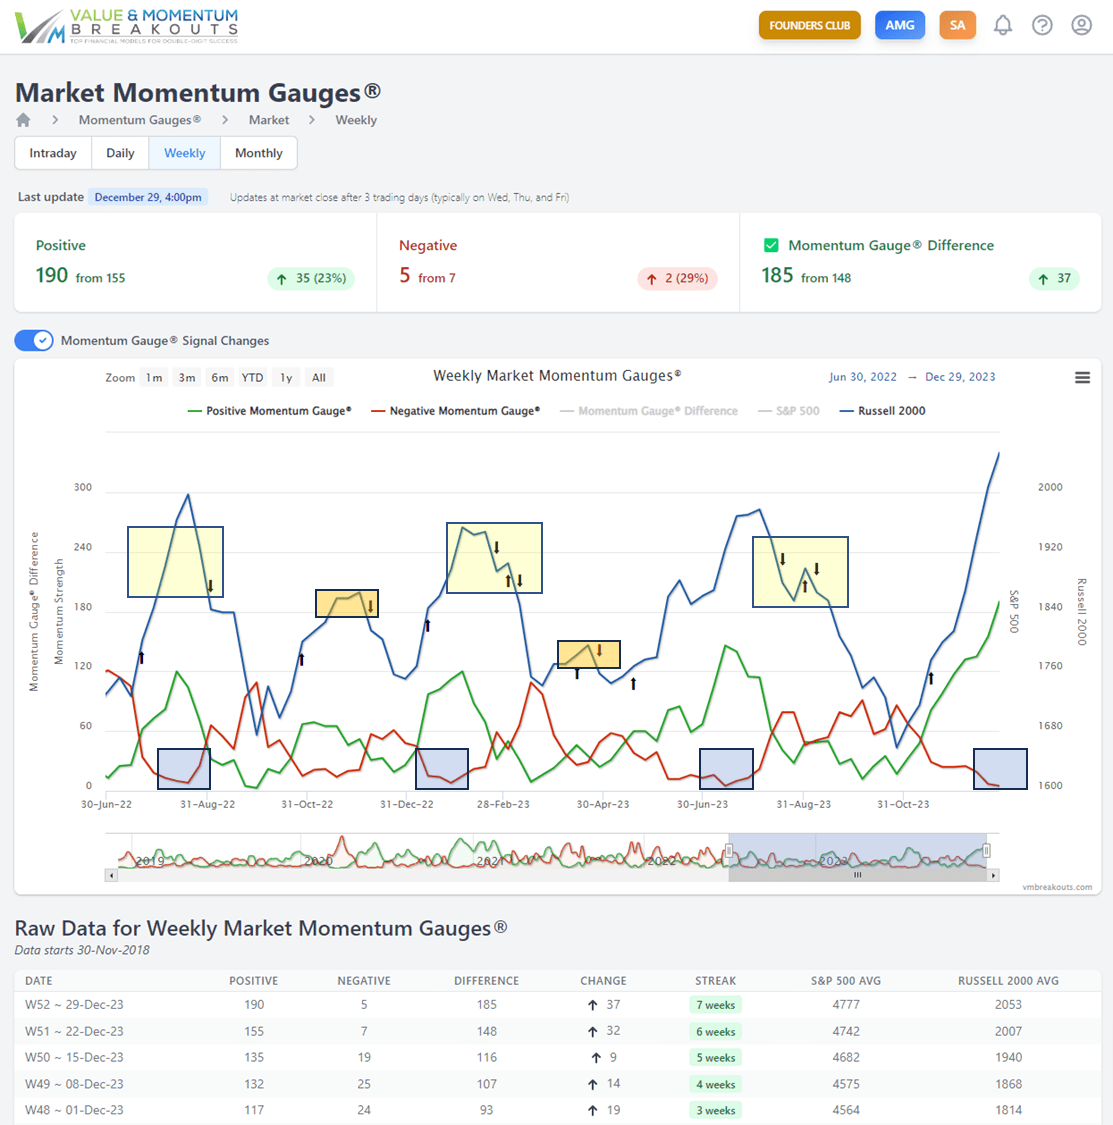
Applying the weekly or monthly momentum gauge signal may provide a smoother timing indicator with fewer signals than the daily gauges. However, the daily gauges are more sensitive to momentum changes and can provide even more time to react to potential market downturns.
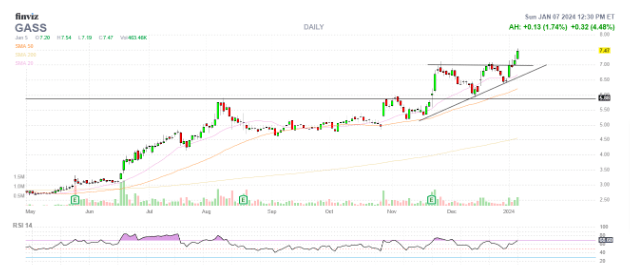
For 2024, one of the long-term value picks from the Piotroski-Graham value portfolio selections is StealthGas (GASS), up 15.63% to start the year. This stock shows the strong fundamental valuations required from both the Joseph Piotroski model and the Benjamin Graham model needed to qualify in this portfolio for a 2-year measured period beginning January 1st, 2024.
2. Forensic Negative portfolio
Why would anyone include a Forensic Negative portfolio among their list of top portfolios from years of research? Doesn’t forensics relate to accounting models that test for manipulation, fraud, bankruptcy, and serious operational concerns? Yes, you can learn more about this model and why it works so well under the right conditions.
The short answer is that time and time again, investors load up on high-risk stocks for all sorts of reasons always convinced that the risk is worth the return. Let’s take a stroll back to late January of 2021 with a look at the GameStop Corp. (GME) short squeeze event that saw over 850% returns in less than a week. Do you remember that massive short squeeze event? GameStop was a negative forensic stock selection that saw record gains not only in that short week but it continued with enormous swings up and down over 200% through July of 2021.
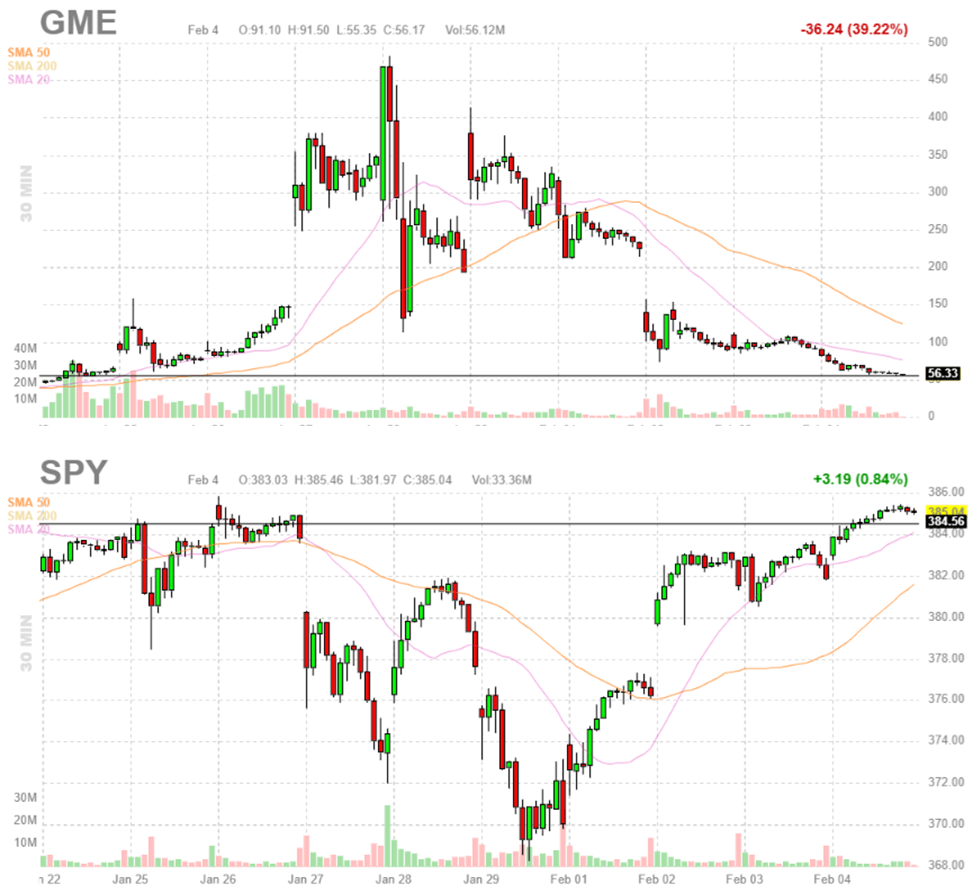
As I show above in time-linked chart with the SPDR S&P 500 ETF Trust (SPY), the inflows to the GameStop exuberance (or insanity) were so large that the S&P 500 saw over -5% declines in the same week. In other words, investors were dumping perfectly good large-cap stocks just for the opportunity to load up a massive negative forensic stock opportunity. Looking back, I believe some of that exuberance was a function of the Federal Reserve’s largest Quantitative Easing program in the history of the United States and the record stimulus was finding its way into every corner of the stock market.
So now, you may have a better idea about why tracking a Negative Forensic portfolio that produced more than 300% returns in the first three years was an important addition to my collection of top long-term portfolios. However, as the Fed’s quantitative tightening replaced massive quantitative easing, I began to highlight the risks of these negative forensic stocks that the Federal Reserve essentially labeled “Zombie” firms. As time goes on, you realize these cycle changes and momentum signals matter:
Despite some bounces along the way on the market momentum gauges in April, these stocks have shown considerable weakness as we approach the end of 2023.
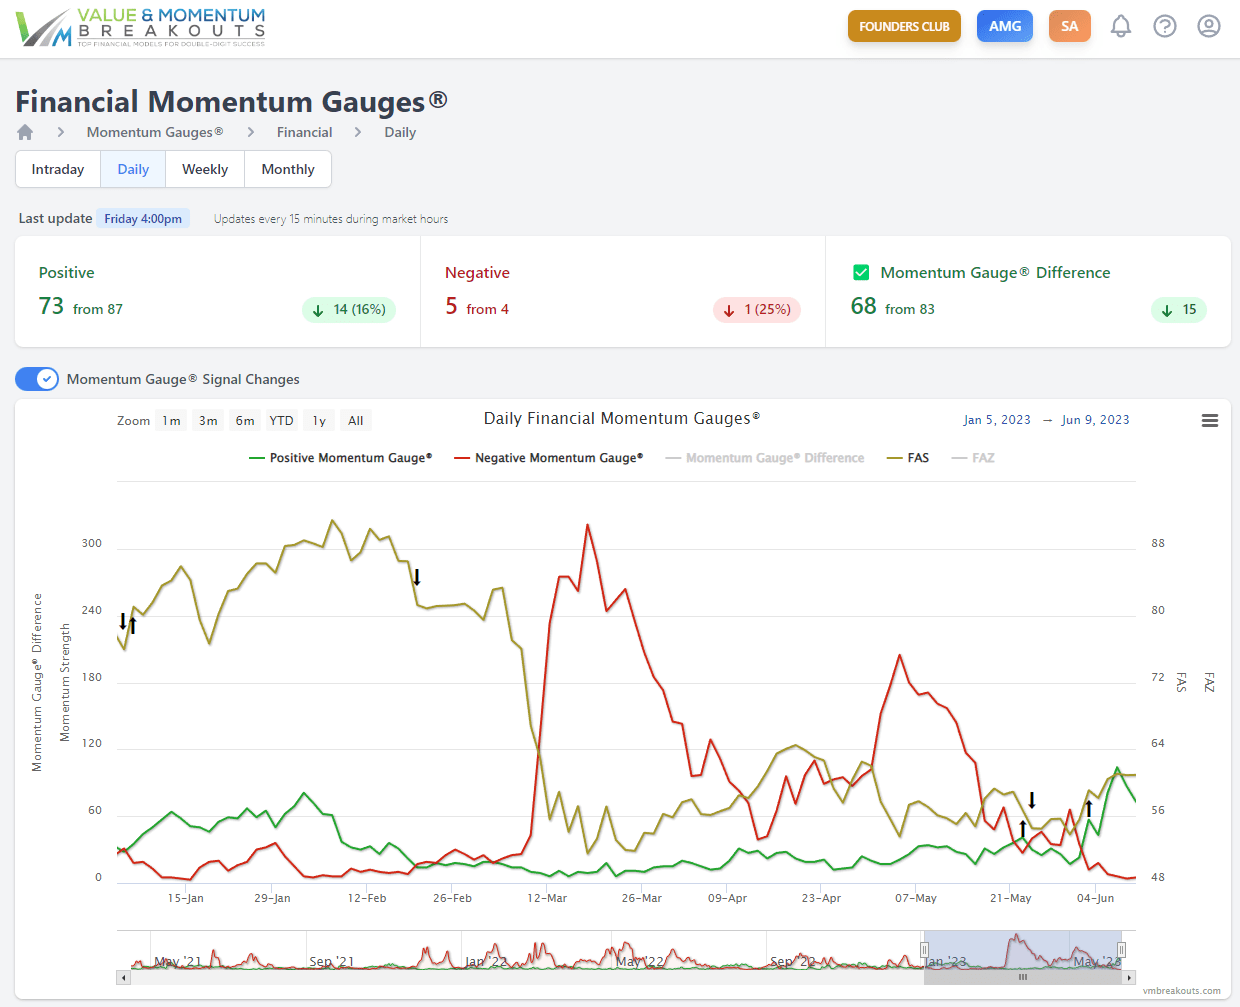
Again, you can see more clearly on the Financial Sector momentum gauges from January just how severe the decline was for the banking sector back in March. The momentum gauges detected a negative signal for the financial sector in the middle of February, weeks before Silicon Valley Bank (OTC:SIVBQ) and others suffered the worst collapse in the financial sector since 2008. A couple of well-known examples of these stocks include Virgin Galactic Holdings, Inc. (SPCE), -42.8% and bluebird bio, Inc. (BLUE), -45.2%
What can we conclude from this unique negative forensic portfolio? One thing I have seen is that when times are good, the stimulus is high, and investors are eager to throw caution to the wind for a big potential payoff at the casino, this is a great model for large gains.
For 2024, one of the long-term picks from the Negative forensic portfolio is Establishment Labs Holdings (ESTA), up +3.94% to start the year. This stock has all the characteristics detailed in my specific Negative Forensic and my Federal Reserve “Zombie” articles for returns consistent with the documented returns of this model type.
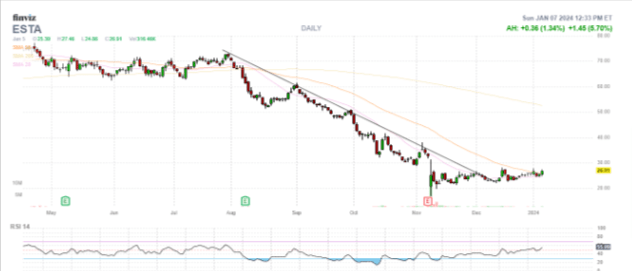
These returns will be measured for one-year and two-year results as shown above in the tables.
3. Forensic Positive Portfolio
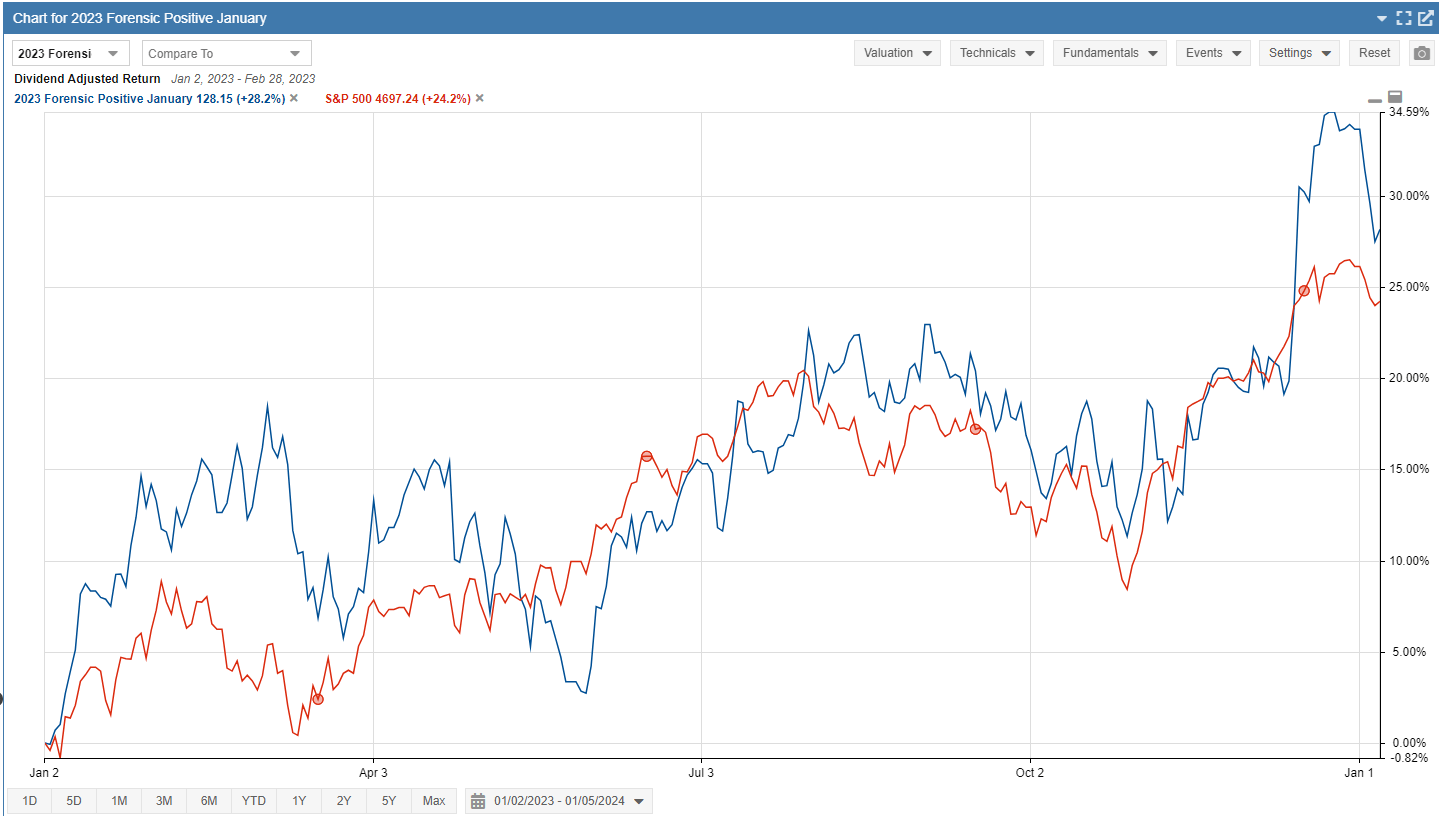
So, if the negative forensic portfolio provides high risk and high return potential, what should we expect from the positive forensic portfolio? You probably guessed, lower returns, lower risks, and only approximately 3x greater compounded returns than the S&P 500. Sure, the total returns are much lower for the positive portfolio than the negative portfolio over the past six years, but the lower risk factors may be worth it.
Last year in 2023, the Forensic Positive portfolio gained +33.8% with dividend adjust returns, beating the S&P 500 but without any of the mega-cap giants that accounted for over enormous percentage of the S&P 500 gains.
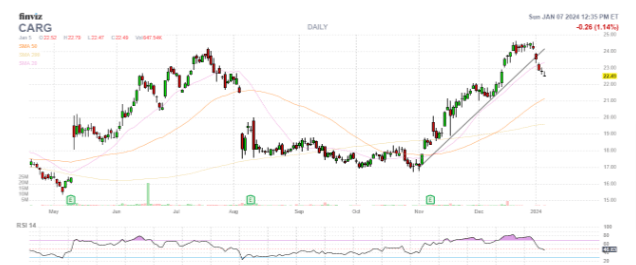
For 2024, one of the long-term picks from the Positive forensic portfolio is CarGurus (CARG), down -6.91% to start the year. This stock has positive forensic characteristics combined with four different forensic algorithms detailed in my forensic articles.
4. The Premium Portfolio
This actively traded portfolio follows member requests for a portfolio that only selects stocks above $1 billion market cap. It also competes for returns among thousands of mid-cap and large-cap stocks usually avoiding the top 1% market cap stocks in the extremely crowded “passive” market index funds.
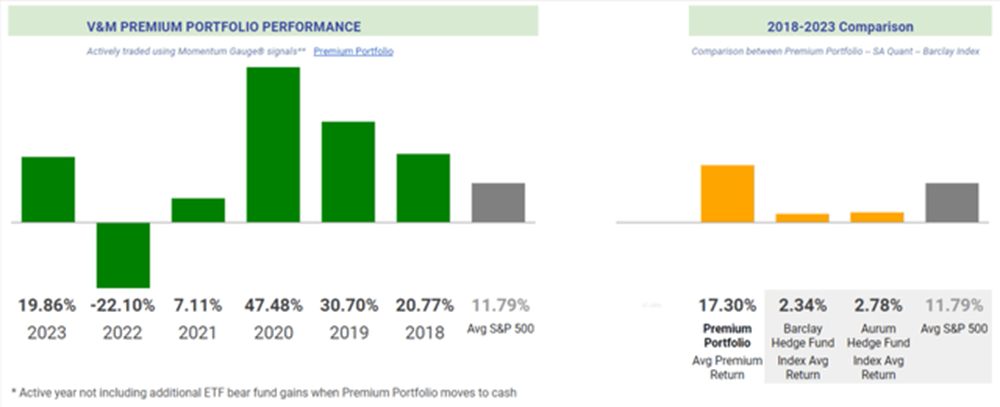
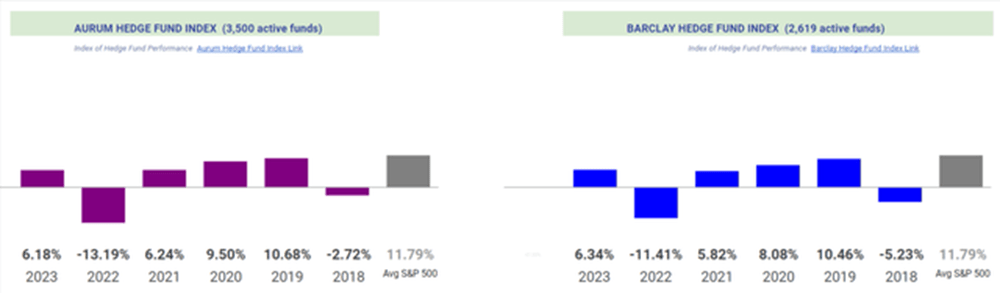
You can see in the comparisons to the Aurum and Barclay hedge fund indices how well this active portfolio has performed over the last six years relative to the leading hedge funds with high expenses and management fees.
Additionally, the Premium Portfolio goes to cash whenever the S&P 500 large-cap momentum gauge signals turn negative. This has minimized losses greatly in 2018 and 2020 and has put the Premium Portfolio in cash for as long as 25 weeks with returns that greatly exceed market and hedge fund indices. Also, long-term readers know that I offer ETF models to trade in bear funds for gains (not added to the Premium portfolio) while these extended negative signals keep the portfolio in cash.
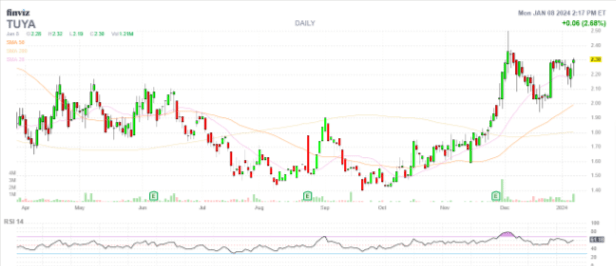
For 2024, one of the long-term picks from the Premium actively traded portfolio is Tuya Inc. ADR (TUYA) using the MDA methodology detailed in my weekly MDA articles. This selection will follow the Momentum Gauge signals for long-term gains as long as the gauges continue positive into 2024.
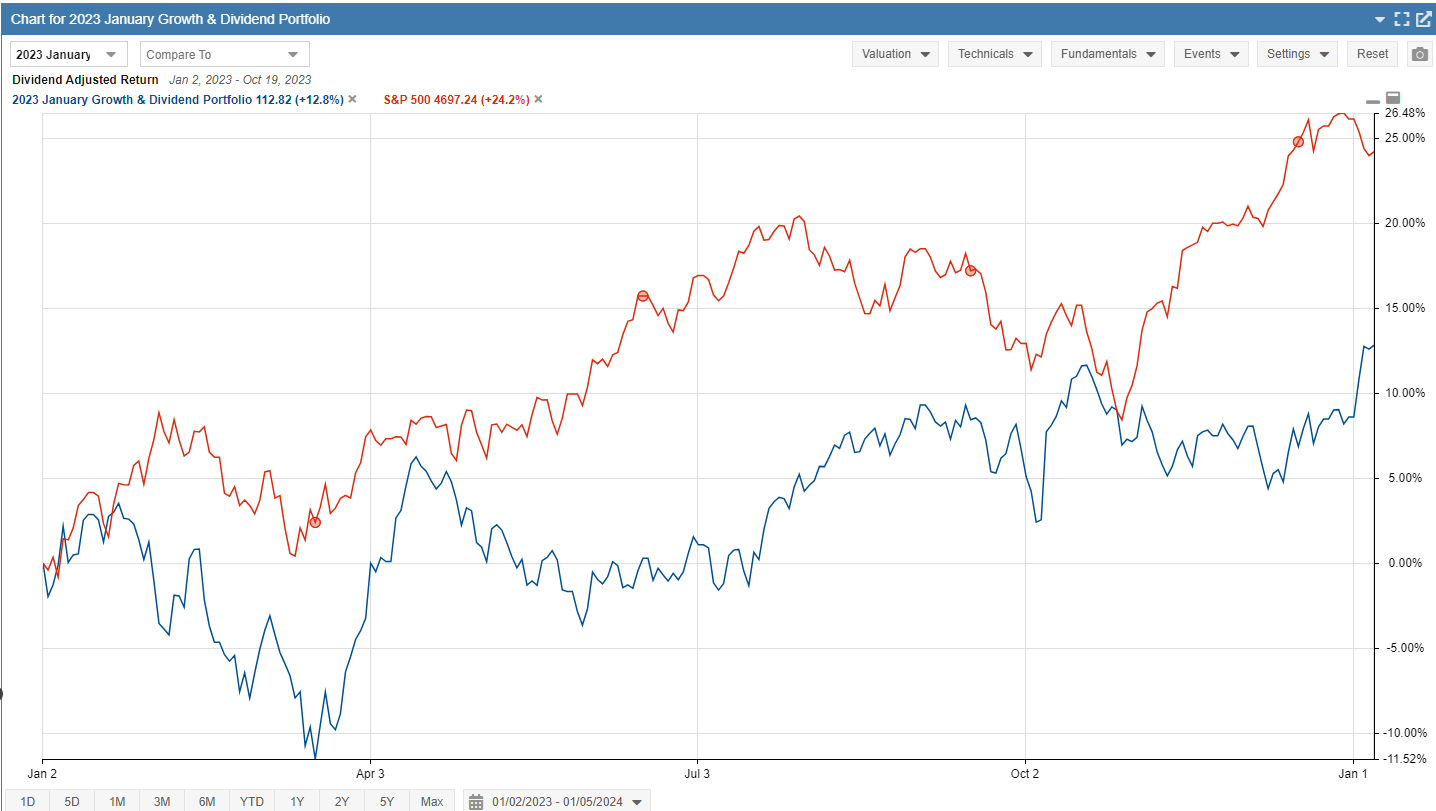
5. January Growth and Dividend Mega-Cap Portfolio
Lastly, let’s look at the long-term growth and dividend portfolio with compounded returns of +84.45% from 2020 compared to +47.8% for the S&P 500 over the same period. The new January portfolio YTD returns are up 2.02% in the first four days of the year as well as sharp gains in the 2023 portfolio from last January. Last year, these selections delivered +9.41% in a buy/hold approach for 2023 adjusted for the high dividend selections in the portfolio.
Every month since 2020, I release a new long-term dividend portfolio for our investing community. The two-year measurements of final returns and peak returns (yellow) of each monthly portfolio are charted below. What you’ll immediately notice are huge two-year returns in the 2020 portfolios followed by a sudden drop-off in high dividend stock portfolio performance.
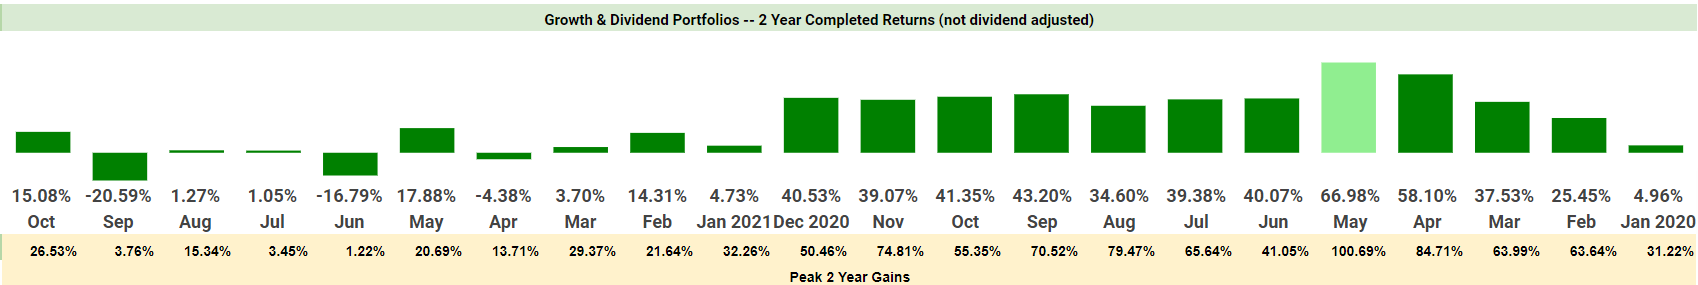
Did the dividend model suddenly fail to work? Did the algorithm just become bad at picking top dividend stocks? No, the macro environment for corporate dividends changed dramatically. Buy/hold performed poorly without a timing method.
As you can see in the BlackRock Corporate High Yield Fund, Inc (HYT) below, corporate dividends took a big hit in 2022 almost as severe as the COVID decline in 2022. Along with the decline in dividend yields, investors have been moving to other investment opportunities, including exiting the stock market in favor of high-yielding treasuries. Could this be a rotation back to dividend investing in the equity market?
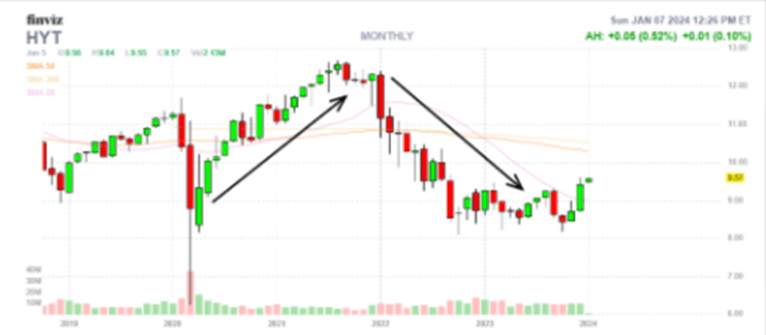
This is yet another example of how important it is to watch the macro market environment.
For 2024, one of the long-term picks from the Growth & Dividend portfolio is Suncor Energy (SU), up +5.49% to start the year. This stock is consistent with the model of large-cap value model, including Piotroski models, combined with high dividend yields detailed in the dividend portfolio articles.
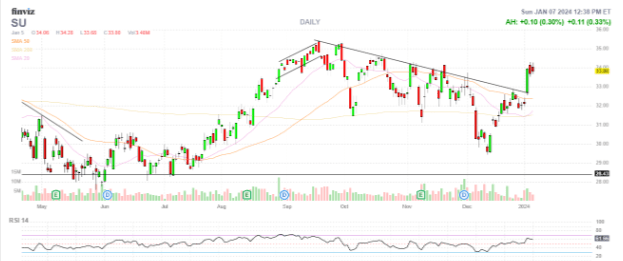
These returns are measured for one-year and two-year results shown above.
Macro/Systemic Market conditions matter
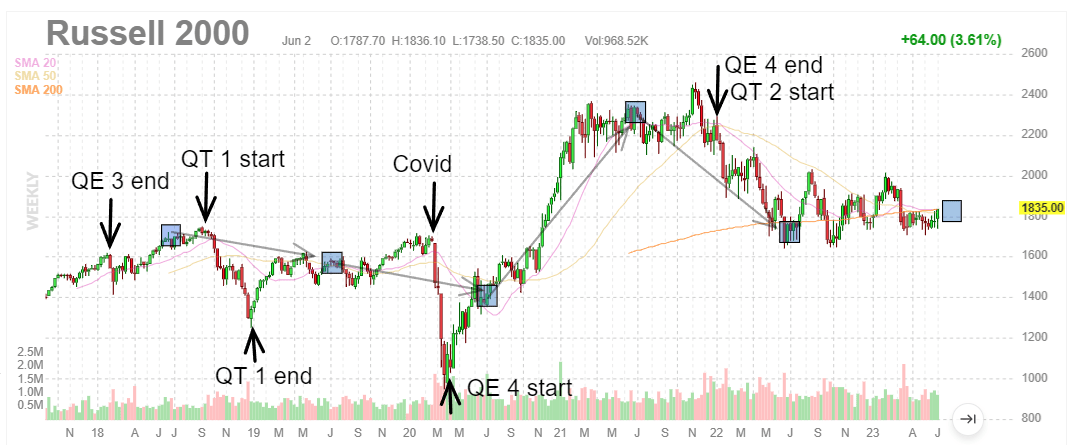
Macro factors from Fed Intervention, and interest rate hikes to COVID corrections matter a great deal. Here we are still in the largest quantitative tightening event in US history with the highest interest rate hikes in 22 years. A review of the 2,000 stocks on the Russell index (reconstituting at every June blue square) back to 2018 shows you the incredible events we have seen in the past six years.
I have written at length about the record Fed balance sheet manipulation to sustain markets since the financial crisis of 2008.
- In what I call QT 1 (the first quantitative tightening event) back in 2018, the Fed tightened its balance sheet for the first time since the financial crisis and the market dropped sharply.
- A cut in rates and the end of balancing sheet tightening gave us all a nice 2019 rebound.
- We all remember when COVID came along and rocked markets again until March 23 when the Fed stepped in again.
- The largest Fed stimulus QE 4 from 2020 to 2021 made every stock picker look like a genius with the highest Fed stimulus in US history.
- Then the Fed halted QE 4 on March 9, 2022, and the markets dropped again on the lack of liquidity.
- 2023 has given us a lot of chops and the most concentrated buying of the seven largest stocks ever recorded in US history.
What concerns are there as Warren Buffett’s Berkshire Hathaway has moved to record high levels of cash last quarter?
Conclusion
Be careful not to chase. The top-performing assets one year are rarely the leading assets in the next year. Investors continually rotate positions in search of the best value or the new best opportunities for large gains.
Financial Resource Corporation summed it up well:
“For those who are not satisfied with simply beating the average over any given period, consider this: If an investor can consistently achieve slightly better than average returns each year over a 10-15 year period, then cumulatively over the full period they are likely to do better than roughly 80% or more of their peers.
I would submit if you follow the momentum gauges and adjust to the changing macro environment you can get much better returns. As we see time and again, returns can easily be erased in the next year. If you are not using some method to adjust your long-term investment signals and strategies, you are at a severe disadvantage. The five unique long-term portfolios I offer are an excellent starting place to design your optimal portfolio around.
I hope these concepts and selections will serve you well in all your investing decisions!
JD
If you are looking for an incredible community to apply proven financial models ranging from Dividends, to Breakout picks, to ETFs, and Long Term Value consistently beating the markets with double digit returns, then join our outstanding members at Value & Momentum Breakouts
- Subscribe now and learn why members are hooked on the Momentum Gauge® signals!
- You can find any type of portfolio to fit your style with proven results.
- Be sure to see why we have so many positive member reviews!
- Now into our 8th year, we have outperformed the S&P 500 every single year!
See what members are saying now – Click HERE