
Summary
- Warren Buffett’s Berkshire Hathaway has reached record-high levels of cash, with $157 billion on hand, exceeding Disney’s market capitalization.
- The last time Buffett held record cash levels was in late 2021, ahead of the 2022 market correction.
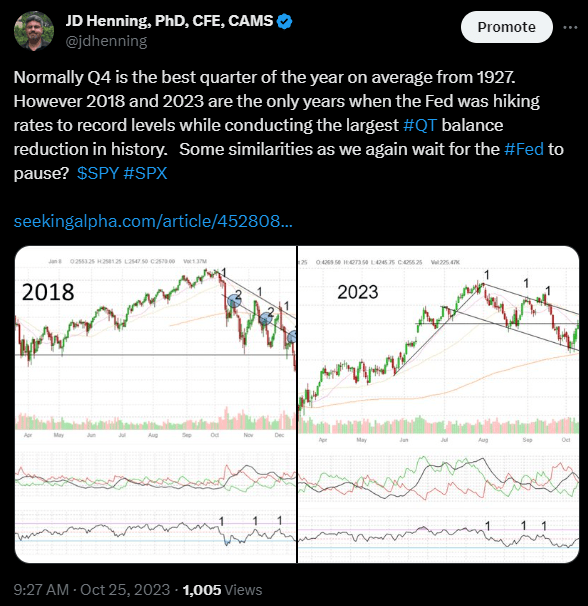
- Similar patterns are observed between 2018 and 2023, the only two years when the Fed hit multi-year high Fed funds rates while conducting the largest QT balance sheet reduction in history.
- The Active ETF portfolio is up +38.0% YTD in an extremely volatile series of swings from the worst week of the year for the Nasdaq/S&P 500 to the best week of the year.
- Timing signals will continue to be essential, as the market swings are increasingly volatile with record declines and rebounds in the last 2 weeks.
- Looking for a helping hand in the market? Members of Value & Momentum Breakouts get exclusive ideas and guidance to navigate any climate. Learn More »

November Market Report Week 45 – 2023
The weekly summary article highlights some of our ongoing market observations, MDA stock breakouts, ETF trading, Dow picks, and long-term value selections throughout the year.
Breakouts Everywhere As Warren Buffett Moves To Record High Cash Levels
We learned Friday that Buffett has moved to the highest levels of cash in two years.
Warren Buffett’s Berkshire Hathaway grew its cash pile by 7% to an astounding $157 billion last quarter, smashing the conglomerate’s previous record of $149 billion in late 2021. Its cash mountain exceeds the market capitalization of Disney, worth $156 billion as of Friday’s close. ~ msn.com.
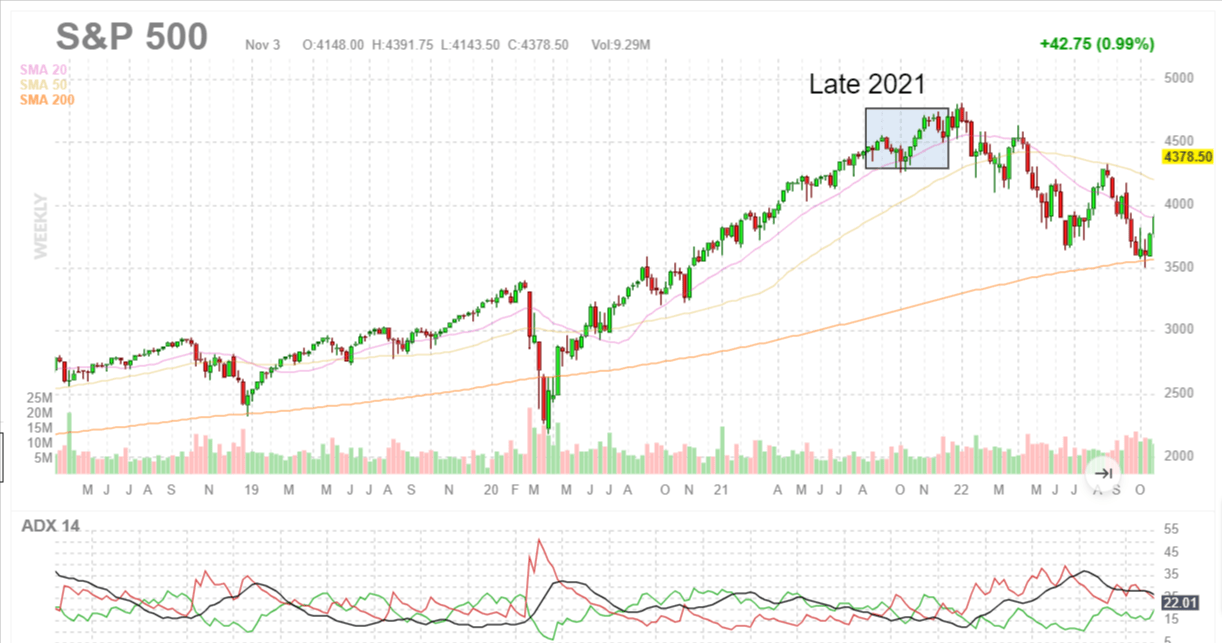
A quick reminder of Buffett’s prior peak cash levels in late 2021 before record market selloffs began in 2022 on the S&P 500 (SPX, SPY) :
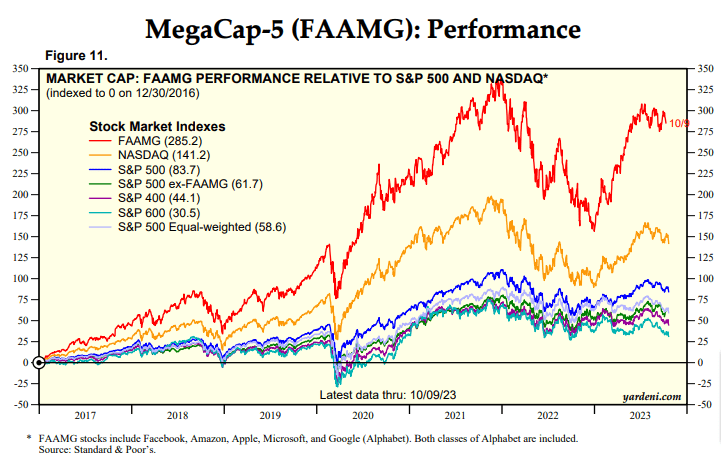
So what now? This puts us into the fourth quarter of 2023, with the widest divergence in the MegaCap-5 from the rest of the market since late 2021.
Based on the reporting on Friday, let’s review the two periods when Warren Buffett’s Berkshire Hathaway (BRK.A) moved to the highest levels of cash ever measured. More cash is currently on hand than the entire market cap of Disney (DIS).
2021 up close on the S&P 500
Looking back at the late 2021 pattern right before the Fed ended record QE and started the current QT program on March 9th, 2022, you can see the difference between stimulated QE bull markets and tightening of liquidity under the QT program with bear markets and increasing volatility.
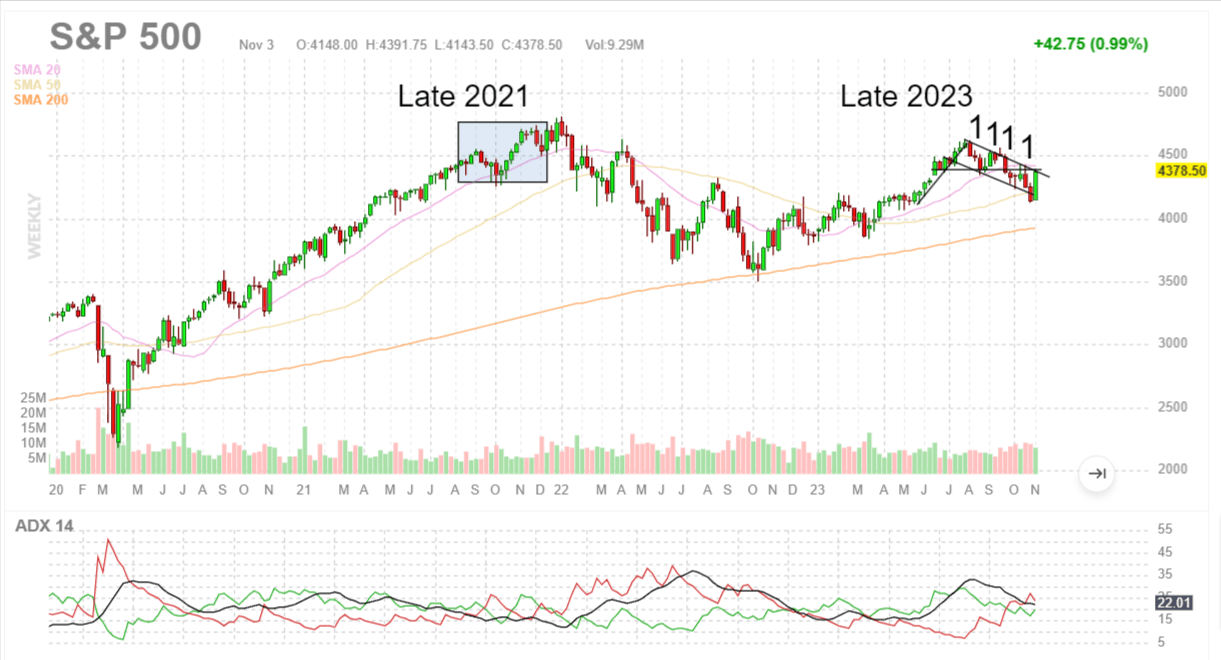
Late 2023 on the S&P 500
We are again looking at high volatility patterns in the negative channel with strong similarities not only to the last time Buffett moved to extreme cash level, but also to the 2018 Q4 pattern.
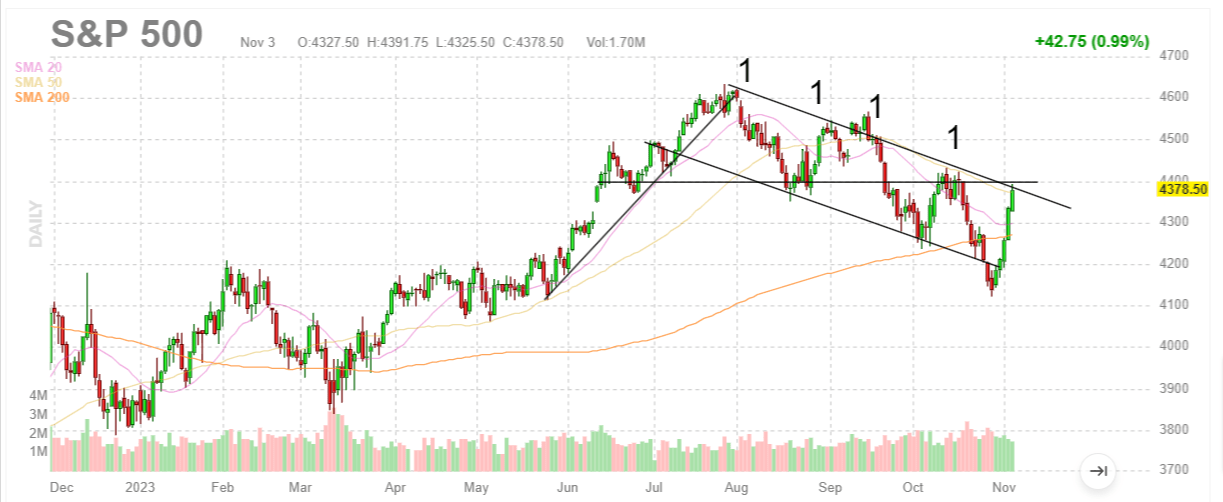
Here’s what I mean we are looking at similar patterns between 2018 and 2023 the only two years in U.S. history when the Fed hit multi-year high Fed funds rates at the same time it was conducting the largest QT balance sheet reduction in U.S. history.
Another Bull Run for Q4 or Market Selloff?
Yes. Likely both after the most rapid melt up this week with the largest gains of the year following Week 43 with the two largest daily declines in the Nasdaq for 2023. We could see these patterns continue as the Fed moves with QT and holds rates “higher for longer” as they did in 2018 until they called an emergency session at the end of December to rescue markets by halting QT and cutting rates. This will depend the most on the Federal Reserve’s actions to year end.
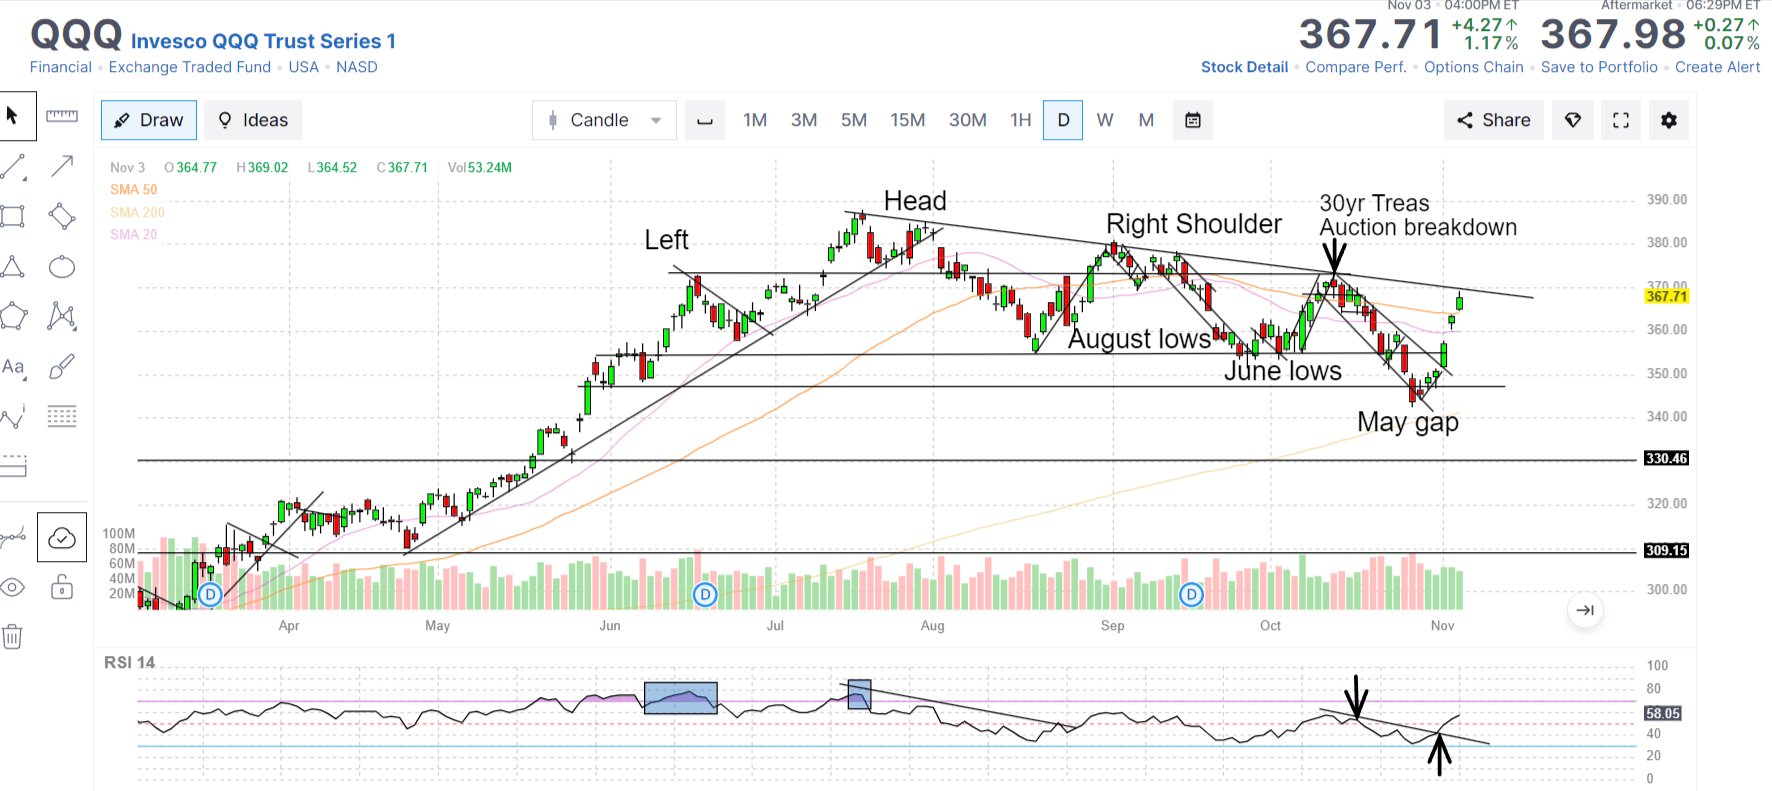
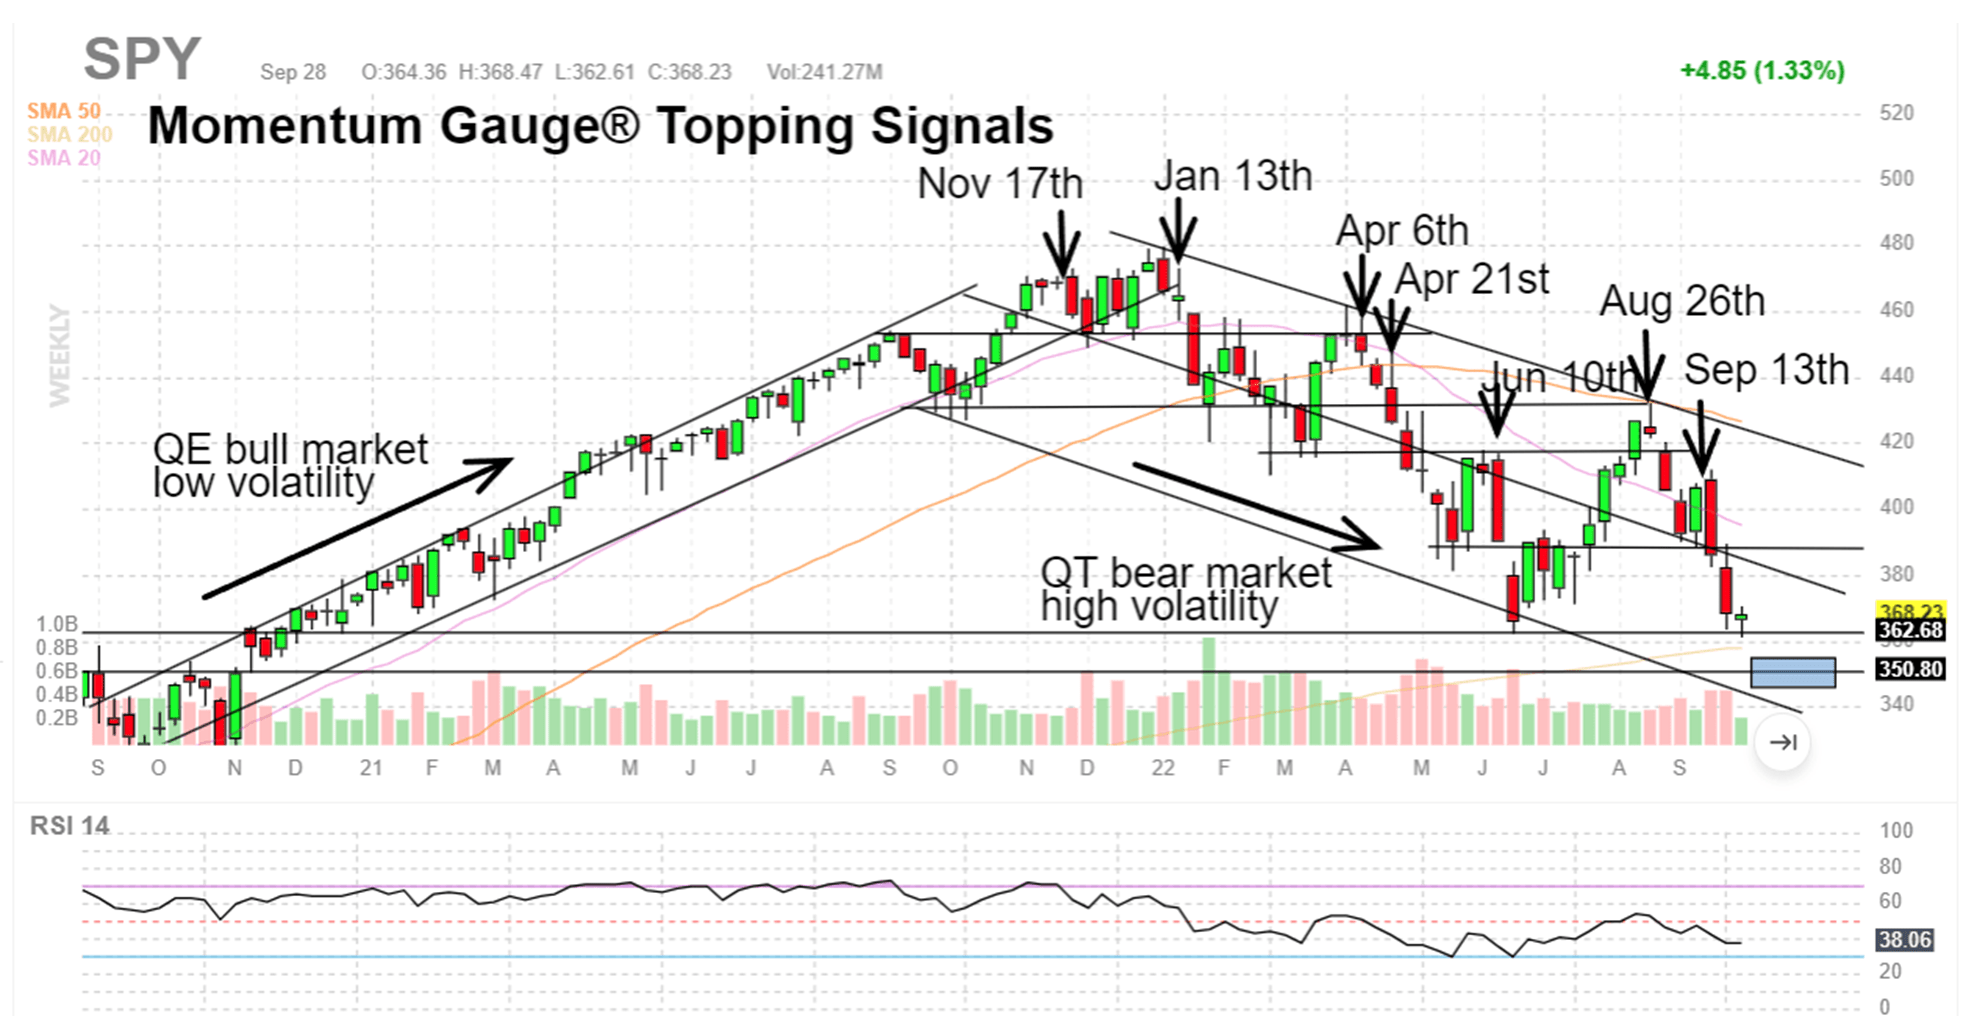
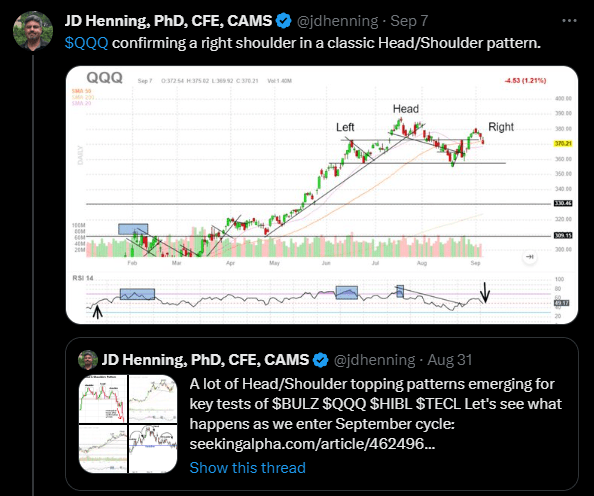
Remember back to my articles and posts in August when we had strong negative Momentum Gauge signals and prominent head and shoulders topping patterns that warned us yet again of a downturn in September? Those peak levels set the “Head” back in July for many of these technical topping patterns over the next several months as I detailed back in early August and September:
- Head And Shoulders Everywhere As Technology And Real Estate Breakdown
- US Debt Downgrade And Apple Breakdown, Major Catalysts For A Cyclical Pullback
- Forecasting The S&P 500 For 2023: Year Of The Fed-Pivot And More Record Volatility.
Where are the Breakouts?
Many of the biggest breakouts are coming from the hardest-hit stocks and funds in the last downturn. Even many of the Zombie stocks down -50% for the year in my last report had extremely large gains last week. Let’s look at three of the funds in the Active ETF portfolio that gained over 10% into the first week of November.
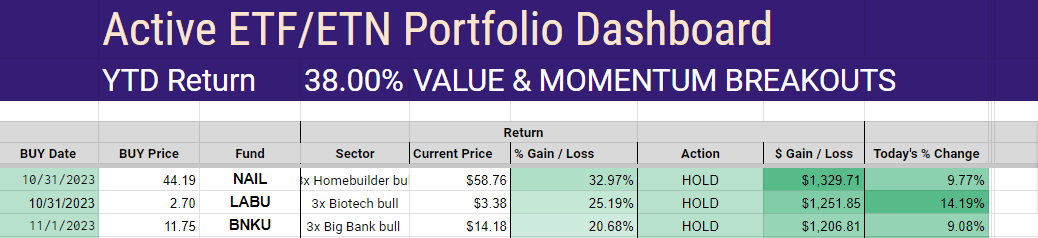
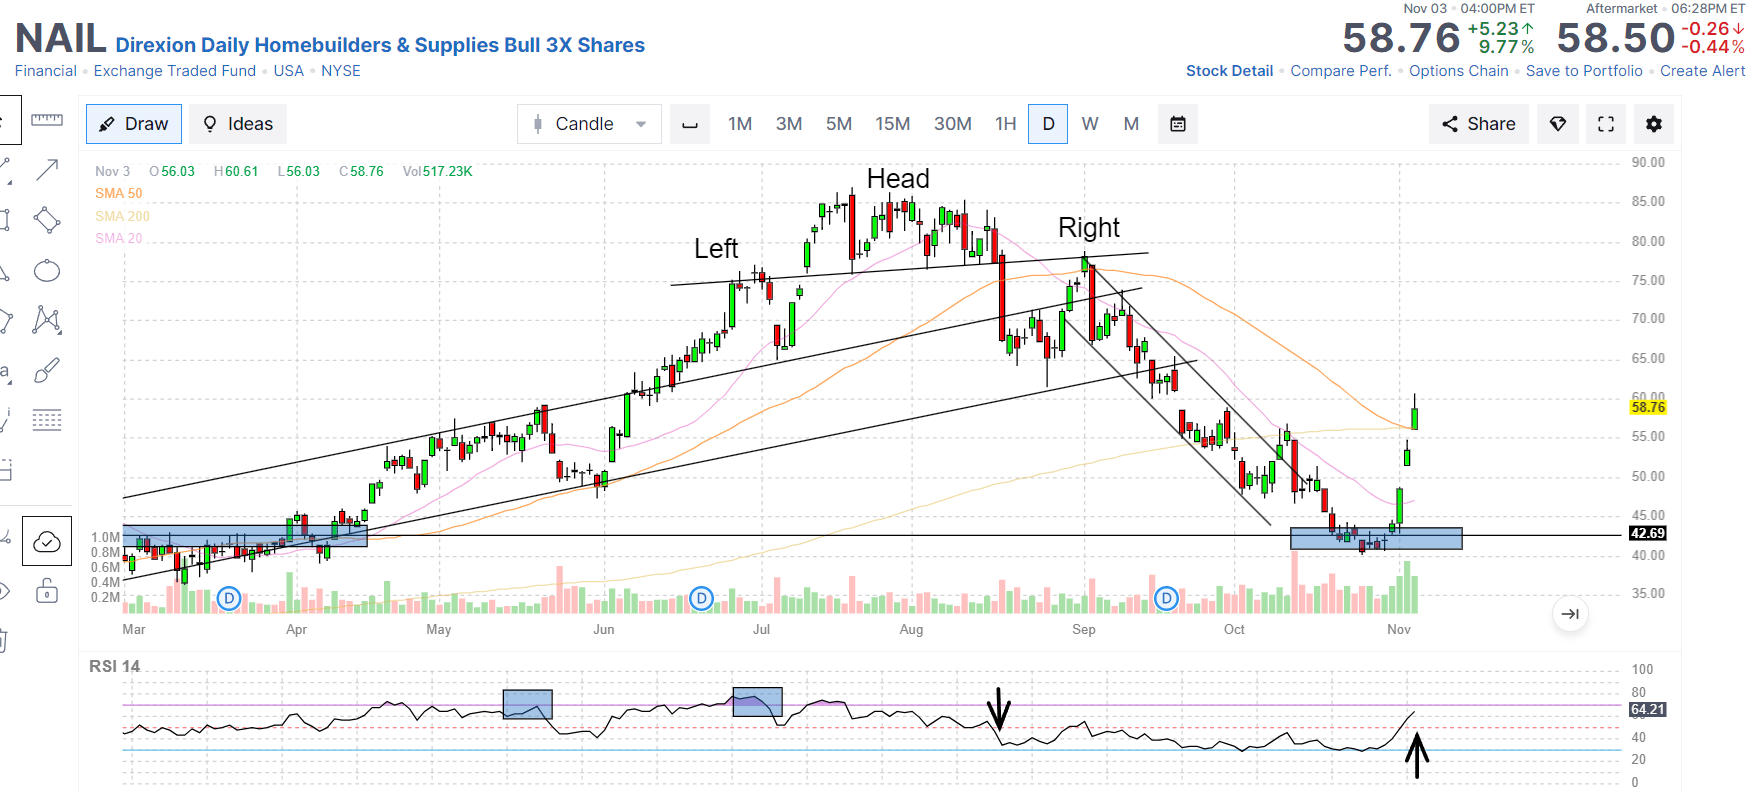
1. (NAIL) Direxion Daily Homebuilders & Supplies Bull 3X Shares, after losing about -50% of its value from the July market peak, managed to rally +33% from our October breakout signal.
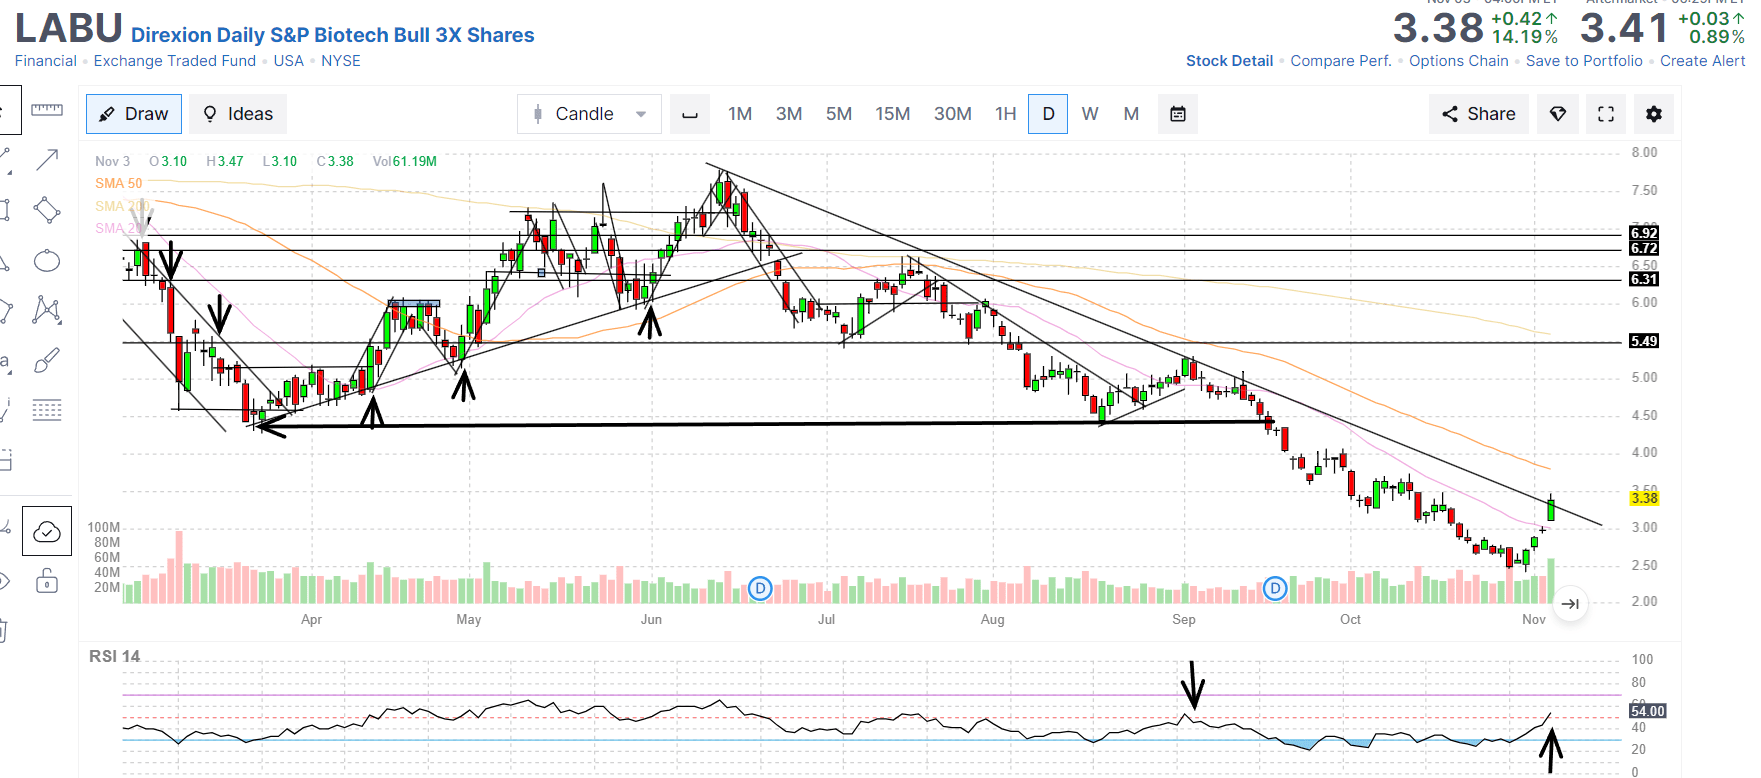
2. (LABU) Direxion Daily S&P Biotech Bull 3X Shares lost about -65% from the June peak and picked up over 25% gains to start November in a rapid reversal and breakout signal.
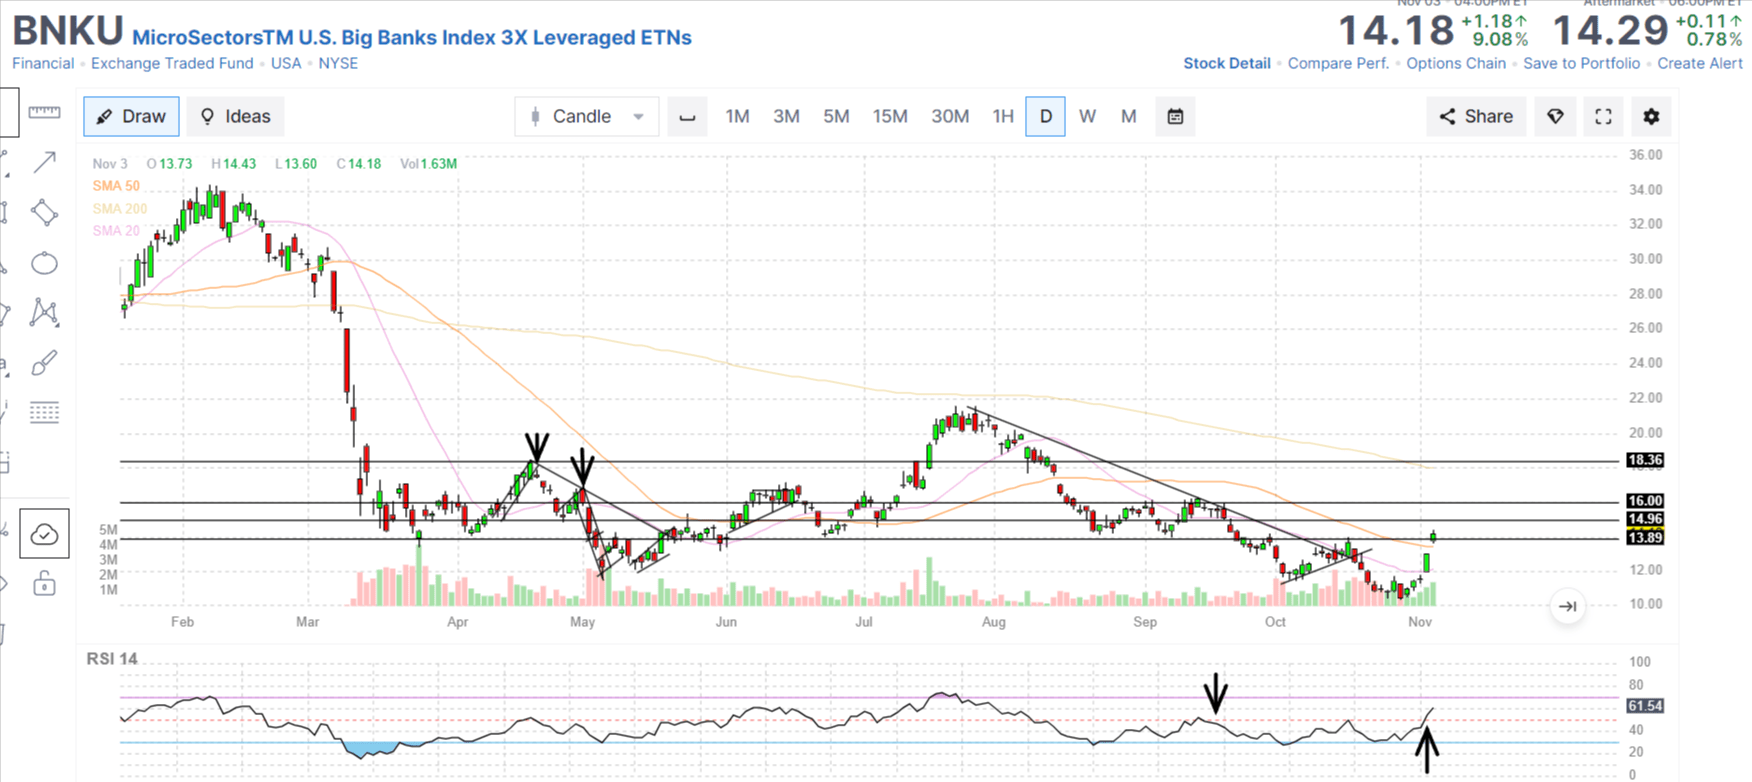
3. (BNKU) MicroSectors U.S. Big Banks Index 3X Leveraged ETNs exploded up over +20% last week after severe declines from the March bank collapse and the July peak. Now testing resistance in a rebound to try to recover more of the -70% declines since February.
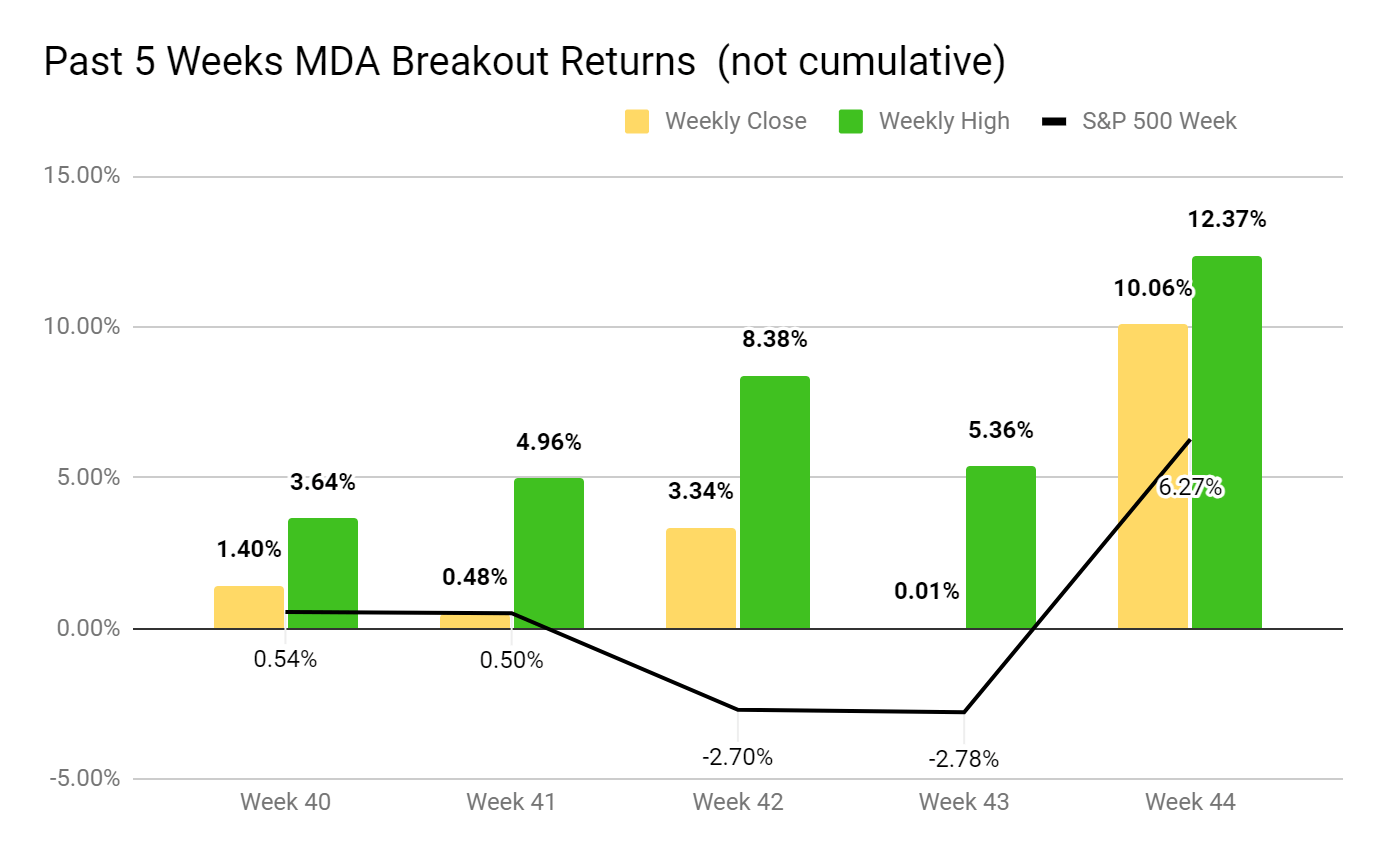
MDA Breakout Stocks the last 5 weeks
The Momentum Gauge signals have been in the longest negative weekly signal since March, 2022 but the MDA breakout stocks continue to beat the S&P 500 again this year.
- Last week 3 out of 4 picks gained over 10% in less than a week with peak gains in ANNX +24.76%, EHTH +11.15%, RIOT +11.59%
- The entire portfolio gained over 10% last week and is delivering consistent weekly gains in the market despite two of the worst weeks in the S&P 500 in October.
- The count of weekly portfolios with at least one stock gaining over 10% in less than a week increased to 263 out of 335 trading weeks (78.5%).
I hope these articles continue to give you valuable insight and different perspectives on the market for the best results possible. All of our long-term portfolios are enhanced by following the momentum gauge signals throughout the year.
I believe these timing indicators and signals can enhance your trading in every market condition.
JD Henning, PhD, MBA, CFE, CAMS.
If you are looking for an incredible community to apply proven financial models ranging from Dividends, to Breakout picks, to ETFs, and Long Term Value consistently beating the markets with double digit returns, then join our outstanding members at Value & Momentum Breakouts
- Subscribe now and learn why members are hooked on the Momentum Gauge® signals!
- You can find any type of portfolio to fit your style with proven results.
- Be sure to see why we have so many positive member reviews!
- Now into our 7th year, we have outperformed the S&P 500 every single year!
See what members are saying now – Click HERE
This article was written by
JD Henning is a Finance PhD, MBA, investment adviser, fraud examiner and certified anti-money laundering specialist with more than 30 years trading and investing stocks and other securities. JD runs Value & Momentum Breakouts where he identifies identify breakout signals and breakdown warnings using technical and fundamental analysis. Signals from his proprietary Momentum Gauges® not only alert subscribers of market changes, but the strength of markets for short term breakouts or breakdown warnings across 11 different sectors. Top stock and ETF selections use technical and fundamental systems in proven financial studies. Value & Momentum Breakouts is the place to build your own optimal portfolio mix with a community of like-minded investors and traders. Features include a Premium Portfolio, bull/bear ETF strategy, morning updates and an active chat room. Learn more.
Analyst’s Disclosure: I/we have no stock, option or similar derivative position in any of the companies mentioned, and no plans to initiate any such positions within the next 72 hours. I wrote this article myself, and it expresses my own opinions. I am not receiving compensation for it (other than from Seeking Alpha). I have no business relationship with any company whose stock is mentioned in this article.
Seeking Alpha’s Disclosure: Past performance is no guarantee of future results. No recommendation or advice is being given as to whether any investment is suitable for a particular investor. Any views or opinions expressed above may not reflect those of Seeking Alpha as a whole. Seeking Alpha is not a licensed securities dealer, broker or US investment adviser or investment bank. Our analysts are third party authors that include both professional investors and individual investors who may not be licensed or certified by any institute or regulatory body.
https://buy.tinypass.com/checkout/template/cacheableShow?aid=CWJjPp7cpu&templateId=OT4NVX2JBJMK&offerId=fakeOfferId&experienceId=EX7X0XJQ71W1&iframeId=offer_faba451c78030d156da7-15&displayMode=inline&widget=template&url=https%3A%2F%2Fseekingalpha.comLike (9)
Unlock to Continue Reading
Get unlimited access to all their articles & research

Value & Momentum Breakouts
by JD Henning
Revealing the best financial models targeting double digit success
Never miss the best stock ideas!