Summary
- Seasonal volatility and midterm election cycles signal heightened risk, favoring a shift toward value stocks with lower volatility profiles.
- Piotroski-Graham and Forensic Value portfolios have consistently outperformed the S&P 500 and hedge fund benchmarks, especially during volatile periods.
- Recent value selections exemplify strong fundamental resilience .
- Strategic sector and market gauge monitoring, combined with value-focused stock selection, enhances risk-adjusted returns during cyclical market rotations.
- Cyclical monthly patterns and midterm elections from 1926 suggest reducing market exposure and leaning into value stocks for the next couple months.

Introduction
“A climate of fear is your friend when investing; a euphoric world is your enemy.”— Warren Buffett
I have spent the last 35 years trading, researching, and constructing algorithms to identify and leverage the value across fundamental, technical, and behavioral finance models. Of the 10 portfolio models designed for optimal portfolio mixes for members to beat the market at Value & Momentum Breakouts, eight come from enhancing well-tested anomaly research in published financial journals.
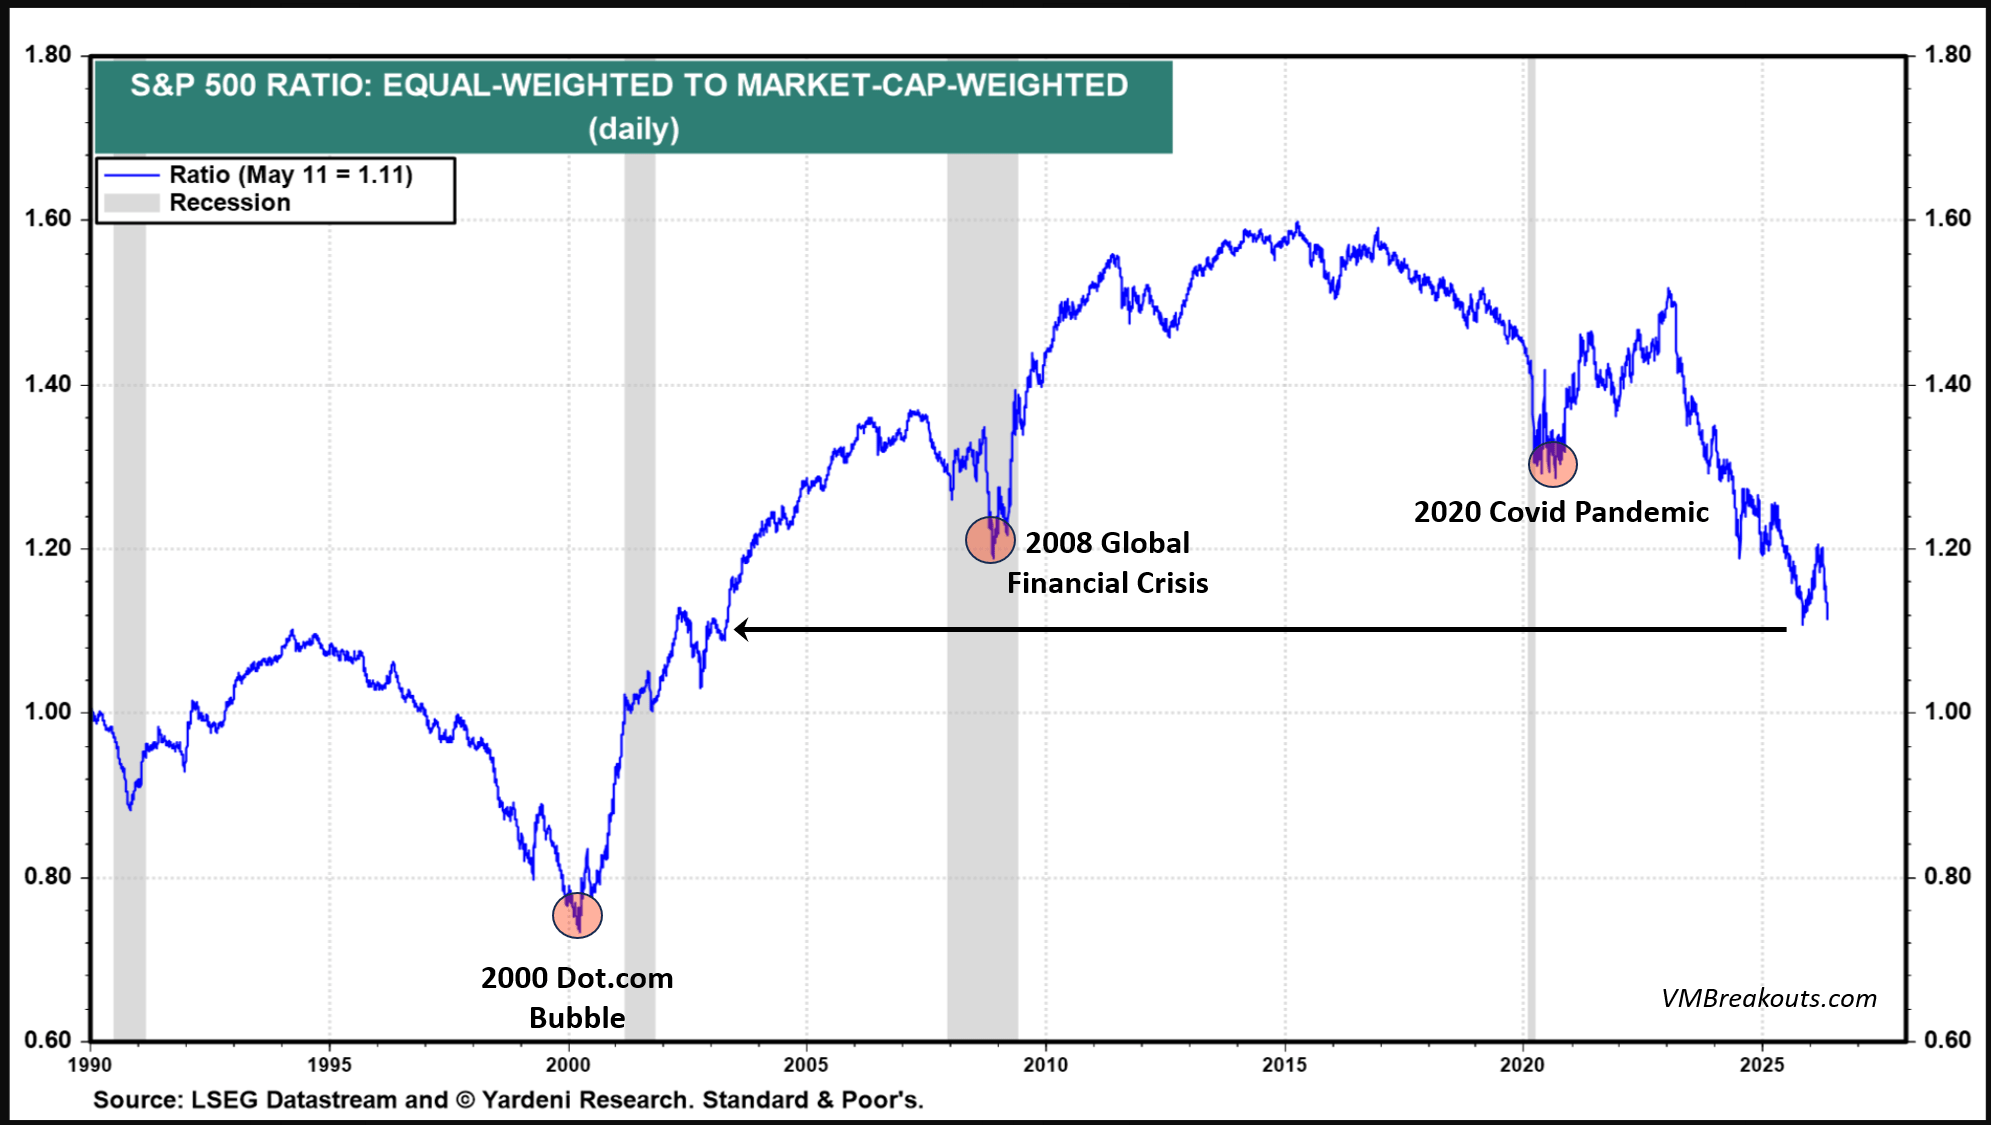
If you believe, like I do, that there’s much more to stock trading than just buy, hold, and hope that every future event works out perfectly as promised for your stock – then these trading models are for you. This article highlights the importance of timing and reveals stocks from our top portfolios that may weather the record rotation likely to come from the most skewed markets in over 20 years.
Midterms, September Volatility And The Value Trade
As I guide investors through seasons, markets, and many diverse stock portfolios, we are back to that part of the year that can be a nauseating rollercoaster. First I will talk about seasonal patterns, especially ahead of a presidential midterm election. Then I will examine the historical September and October volatility patterns. Lastly, I will highlight some value trades from our value portfolios significantly leading the S&P 500 again this year and over the past 9 years. As a reference you read recent articles related to this one and prior selections that are going strong
- While Everyone Chases AI, Value Remains A Winner: New Mid-Year Piotroski Selections
- The Hidden Edge: Nine Years Of Market Outperformance From Forensic Value Investing
Midterm Election Markets
Historically by quarter the S&P 500 is weakest in Q2 and Q3 of a midterm election year with strong gains post election. The chart below is based on midterm election years from 1925 to 2023. The historical trends are overwhelmingly positive after the elections and mostly negative ahead of uncertainty through Q2 and Q3.

The table below reflects midterm elections from 1926 to 2022. The largest S&P 500 drawdown so far in 2026 is -9.1%, somewhat comparable to 1986 and 1994. In both years the S&P 500 saw large post midterm gains.
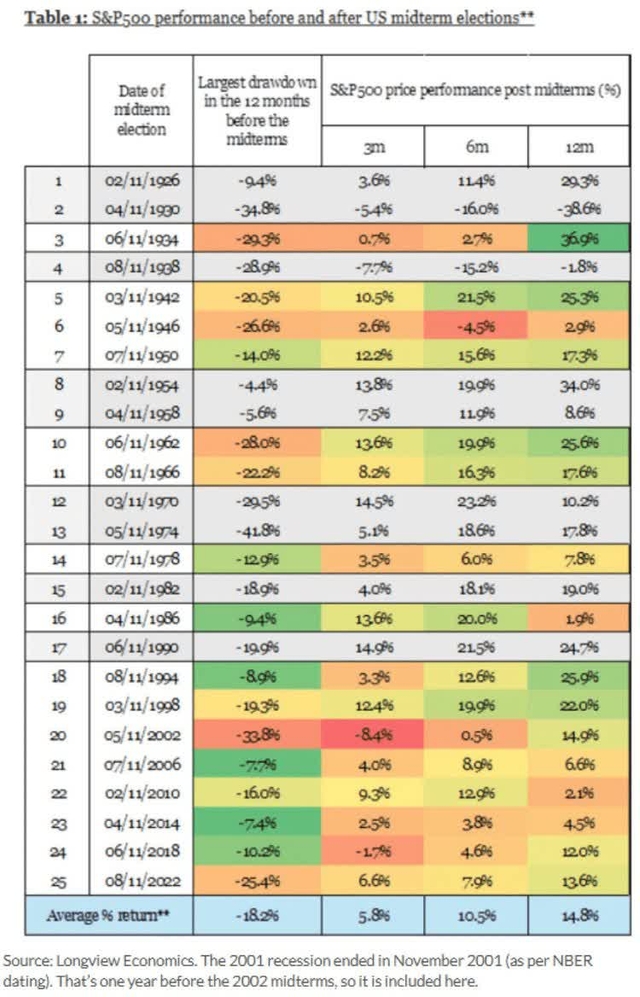
One last factor this year that shares midterm election commonality with 1930, 1934, 1970, 1978, 2006, and 2014 is the impact of a new Fed Chair appointment that same year with an average -9% drawdown in the 6 months following the Fed appointment. Potentially of significance, the drawdowns were larger in those post-appointment years that were also in the midterm election cycle averaging -11.1% drawdowns.

S&P 500 Volatility Index Seasonality
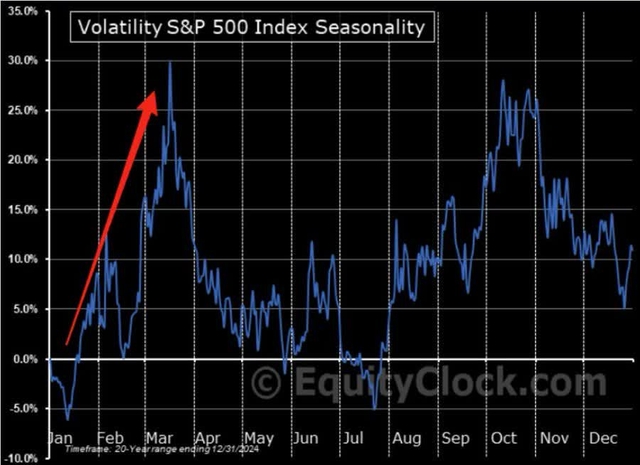
Those seasonal drawdowns in the midterm election cycle combined with historical monthly patterns of volatility over the last 20 years show bimodal volatility peaks in March and October. March is particularly high due to the extreme 2020 Covid correction that saw over -35% declines for the S&P 500 and skews the cyclicality of the index. August to October continues throughout many decades to produce the highest consistent annual volatility for the S&P 500.
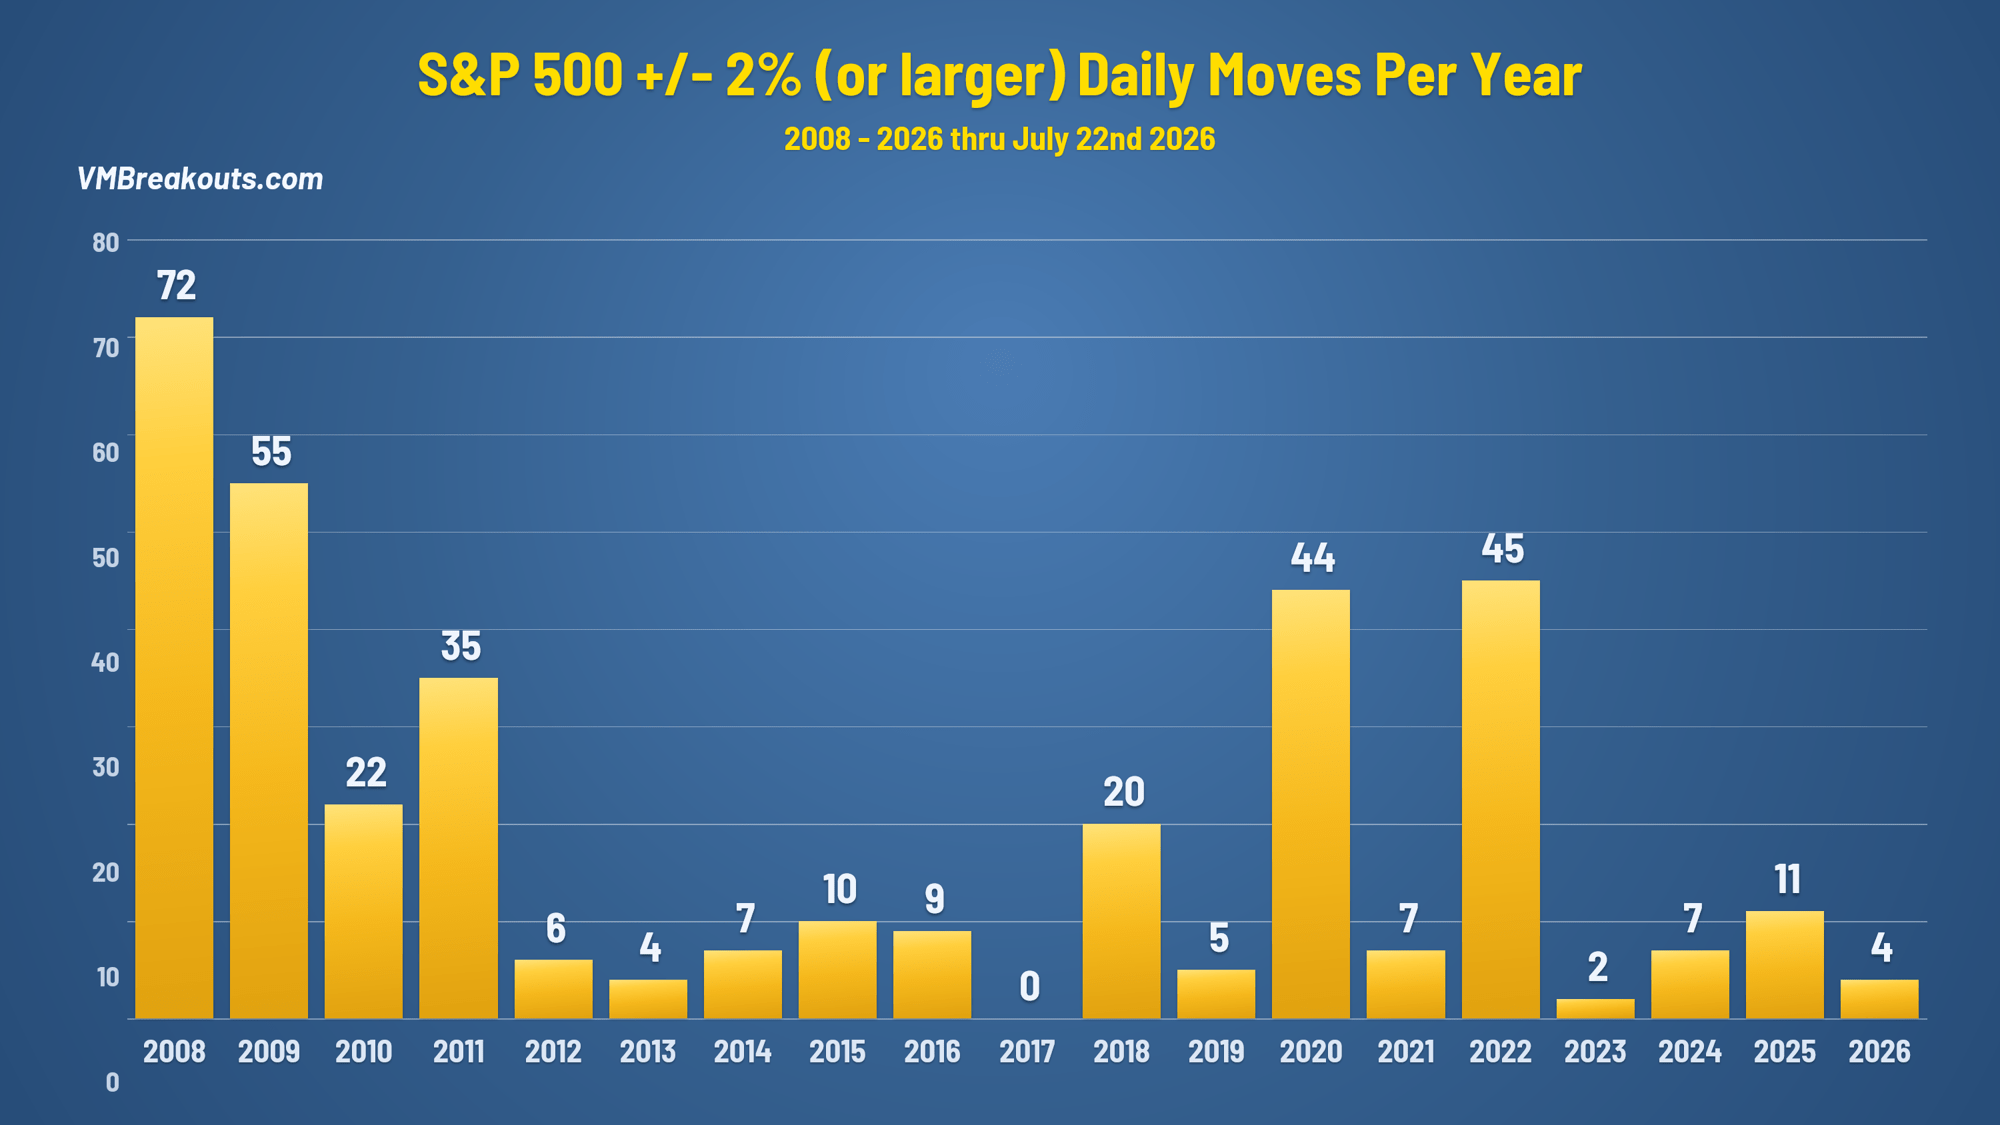
In my tracker from 2008 measuring large daily moves of +/- 2% of the S&P 500 you can see that the overall index volatility is below average with only four events YTD with the last big move of -2.64% back on June 5th.